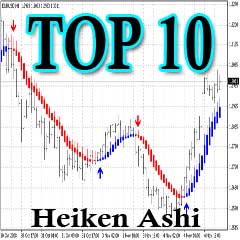
How to identify the direction of the trend with ZMA Heiken Ashi system. Learning how to identify the trend is critical but what may surprise you is that trend identification is by and far the easiest skill for traders to develop. And the ZMA Heiken Ashi System is the easy way to identify the direction of the trend.
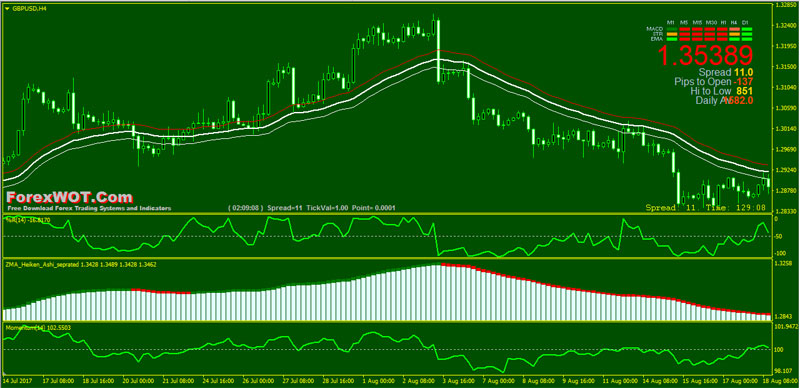
Today’s article will show you simple indicators and trading system to make sure you’re giving yourself a fighting chance by only looking for trading opportunities in the direction of the trend.
Once a trend is found, traders can choose from a variety of tactics to enter the market.
One of the easiest ways to enter the market is through the use of a Heiken Ashi indicator. The Heiken Ashi indicator provides interpretation of market trends in a neat and descriptive way.
Unlike regular Japanese candles, ZMA Heiken Ashi doesn’t show open, high, low and close. Instead, they calculate values of each candlestick based on the dominant forces in the market. E.g. if bears (sellers) are clearly dominating, ZMA Heiken Ashi will be bearish (RED color), even if a price bar closes higher than it opened.
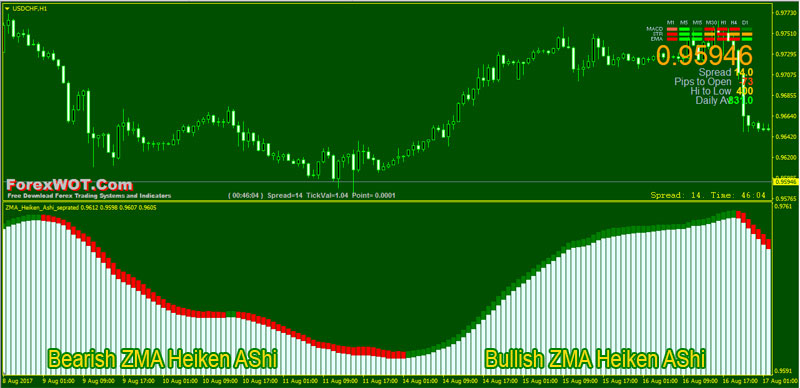
This Heiken Ashi indicator is a perfect tool for traders who like following trends to their very extended. Heikin Ashi Candles also looks much more simplified.
An often stated complaint is that most indicators are LAGGING.
First off, of course, they are as they’re calculated from historical prices and any thoughts on what will happen tomorrow, next week, next month or more is just a guess. Secondly, a LAGGING indicator is a good thing in the world of trend trading.
A LAGGING indicator will prevent you from overreacting, which is one way that traders beat themselves with little effort from the market.
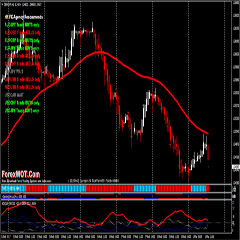
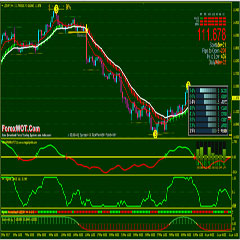
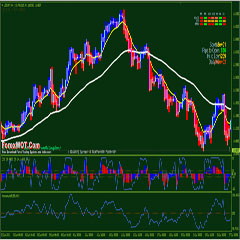
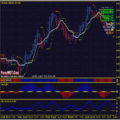
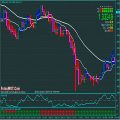
Forex ZMA Heiken Ashi System is the easy way to identify the direction of the trend based on ZMA Heiken Ashi, 34 EMA, Williams’ Percent Range, and Momentum indicator. This system is very simple.
- Best Time Frame: 4 Hour and Daily
- Recommended Currency Pairs: GBPUSD, USDCAD, and USDJPY
If you want to use more moving averages as a filter, you can apply the 50 MA to the daily timeframe and then only look for trades in the direction of the daily MA on the lower timeframes.
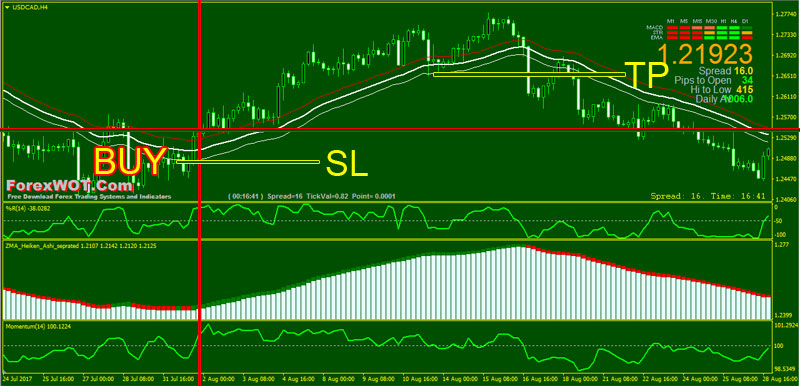
- ZMA Heiken Ashi Green color
- Williams’ Percent Range line upward above -50 level
- Momentum line upward and above 100 level
- Price (bullish candle) and above 34 EMA High (Red color line)
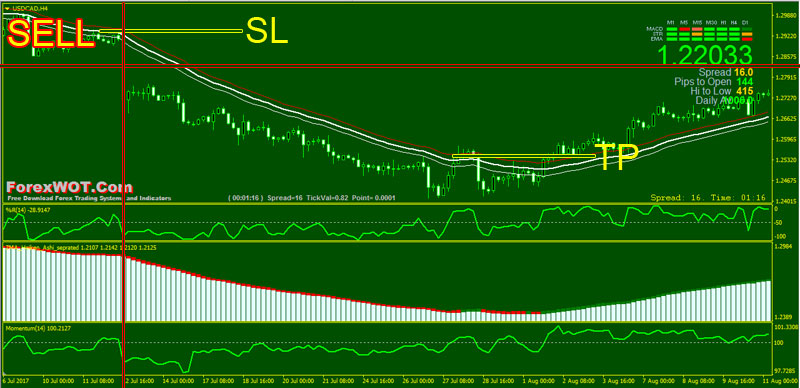
- ZMA Heiken Ashi Red color
- Williams’ Percent Range line downward below -50 level
- Momentum line downward and below 100 level
- Price (bearish candle) and below 34 EMA Low (White color line)
The only thing that could make this system fail over the long term is you not sticking to the rules…….that’s it!
If you stick to the rules of the system, you’re going to be smiling from ear to ear as you watch your account grow at an astonishing rate every month from now on.
The ZMA Heiken Ashi System is incredibly simple and easy to use. Once you are used to it and have made a few trades with it, you’ll find that you’re spending very little time actually running with this system.




why the ZMA not work
Hi kitti and LIBIN, ZMA works well in my MT4..
Thanks to forexwot. You’re the best
yes!L AM TOO! ZMA HEIKEN为不显示,WHY?
Thanks Sir..
This is a super easy trading system. ZMA Heiken Ashi is good tool and i love it.
I use 34 EMA high and low to trail my stop loss. Thanks Sir
Please cheak ZMA Heiken Ashi indicator does not show histogram and line color *