Forex & Binary Options 4 Hour Time Frame Trend Following Trading Strategy – Best Forex & Binary Options 4 Hour Strategy with Heiken Ashi EMA Trend System. Trend Following is a trading methodology that, seeks to capture trends across all markets, using proper risk management.

Although this strategy can work well on all time frames, it is best to be used on the 4H time frame, which makes it highly suitable for swing traders.
In this strategy, the 4H chart is used as the base chart (this is where we screen for potential places on the chart where trading signals may occur) and the 1H time frame as the signal chart, or the trade chart (where we execute orders according to this strategy).
If you choose to use a different time frame as the base chart remember that you go one-time frame lower for the signal chart (so if 1H is the base chart then the 30M time frame is the signal chart).
The main cornerstones of this strategy are as follows:
We need to have a trend. This strategy rests on trend behavior and without one it basically can not be used.
Heiken Ashi Indicator is said to remove the “noise” from candlesticks and to behave much like a moving average.
Traders use Heiken Ashi to determine the relative strength of a trend and to pinpoint key turning points in price behavior.
The Heiken Ashi application tool takes the basic candlestick information, the open, close, high, and low, and then “smoothes” the erratic portions of the chart in much the same fashion as would a moving average.
Traders can then make a better-informed decision without the distractions caused by volatile price action.
Heikin-Ashi price bars are averaged, so each one won’t reflect the exact open, highs, lows and closes for that period like a normal candlestick would. HA candles are calculated using the following formulas:
- HA Close = (Open + High + Low + Close) / 4
- HA High = Maximum of High, Open, or Close
- Low = Minimum of Low, Open, or Close
- Open = (Open of previous bar + Close of previous bar) / 2
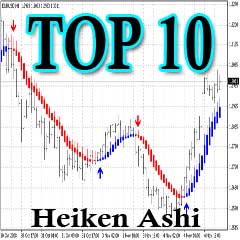
Software programs perform the necessary computational work, and the Heiken Ashi tool produces a more visually appealing chart as displayed below:

The benefit of the Heiken Ashi indicator is its visual simplicity.
Trading channels appear more tightly formed, and major trends are easier to detect and follow.
However, it is highly recommended that the use of Heiken Ashi be combined with another indicator to provide confirmation of interpretations.
Trading on Heiken Ashi charts is similar to trading on other charts. Focus on trading in the direction of the overall trend. Use Heiken Ashi price bar characteristics to determine trend strength, when the trend is slowing down and apply other technical analysis concepts (such as
Use Heiken Ashi price bar characteristics to determine trend strength, when the trend is slowing down and apply other technical analysis concepts (such as trend lines) to isolate major price reversals.
- Best Time Frame: 4 Hour
- Recommended Currency Pairs: GBPUSD, EURUSD, and USDJPY (this strategy can work well on all currency pairs)
- Heiken Ashi (ProfitableStrategy 7)
- Exponential Moving Average
- SwingForce
- Level ZZ Semafor
- ++ +Agimat
- MT4 Currency Power
- Signal Trend
- Cracked Mega FX
- ++ +Agimat OBOS V1.1
- +++Agimat MarketWatch
- Solar Winds Joy Histogram
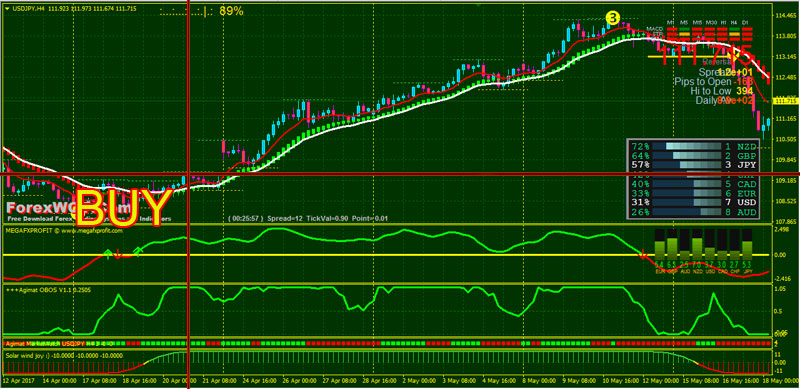
- Price upward above Green color Heiken Ashi (ProfitableStrategy 7)
- 8 EMA Red color line upward above 21 EMA White color line
- Mega FX Profit Green color above 0 level
- +++Agimat line upward above 0.5 level
- +++Agimat MarketWatch Green color
- Solar Winds Joy Histogram Green color above 0 level
- Signal Trend Green color bars

- Price downward below Red color Heiken Ashi (ProfitableStrategy 7)
- 8 EMA Red color line downward below 21 EMA White color line
- Mega FX Profit Red color below 0 level
- +++Agimat line downward below 0.5 level
- +++Agimat MarketWatch Red color
- Solar Winds Joy Histogram Red color below 0 level
- Signal Trend Red color bars
Practice this strategy on a demo account first so you can fully grasp everything before going live. If you find it helpful some back testing on past price data is a good way to learn and master this trend following strategy as well.
[sociallocker]
[/sociallocker]


