ForexWOT RSI and Heiken Ashi Chart Bars Trading System – Forex Simple Trend Following Trading Strategy Based on RSI Momentum and Heiken Ashi Chart Bars. The RSI is a Forex momentum indicator, and it is the best momentum indicator.

The Relative Strength Index definition is as a momentum oscillator. It shows whether the bulls or bears are winning over the look-back period, which can be adjusted by the user.
Relative Strength Index Technical Analysis
The RSI indicator is typically used in forecasting and trading strategies in the following ways:
- When the RSI is over 70, it should be expected to fall. A fall below 70 from above 70 is taken as confirmation that the price is beginning a move down.
- When the RSI is under 30, it should be expected to rise. A rise above 30 from below 30 is taken as confirmation that the price is beginning a move up.
- When the RSI crosses above 50 from below 50, it is taken as a signal that the price is beginning a move up.
- When the RSI crossed below 50 from above 50, it is taken as a signal that the price is beginning a move down.
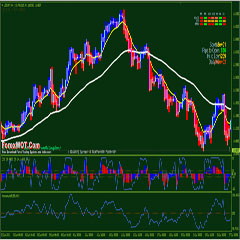
ForexWOT RSI HA Chart Bars Trading Rules
If you are going to use the RSI, the best way to use it is to trade long when it is showing above 50 on all time frames, or short if below 50 on all time frames.
- Best Time Frame : 60min, 240 min, and Daily
- Recommended Currency pairs and Indicies : EUR/USD , USD/JPY, GBP/USD, AUD/USD, USD/CHF, AUD/JPY, NZD/USD and other majors.
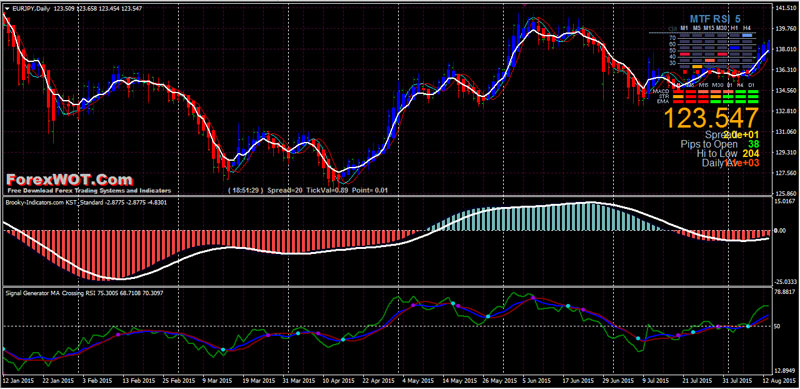
Metatrader Trading Indicators
- RSI bars, (55 period 55 period with 50 oversold & overbought )
- RSI Chart bars( 55 period)
- Signal Trend
- Heiken Ashi
- Signal Generator MA Crossing RSI
- MACD
BUY Rules
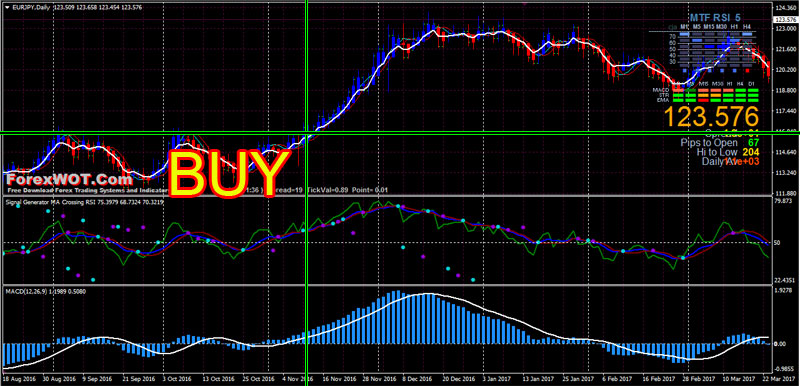
- RSI Chart Bars blue color;
- Signal Generator MA Crossing RSI upward above 50 level
- MACD uptrend
- Heiken Ashi chart blue color
- Signal Trend green color
SELL Rules
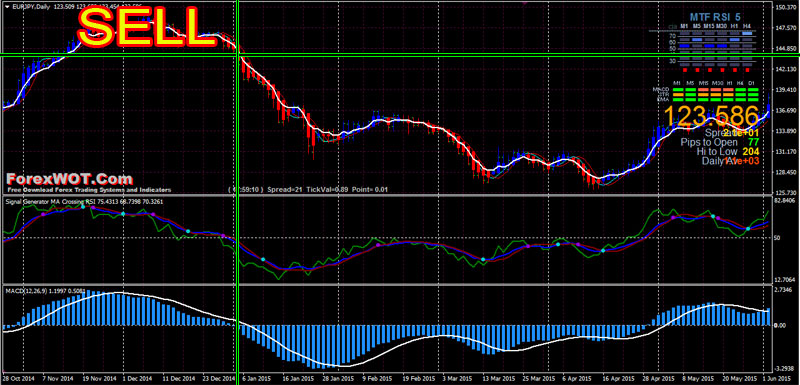
- RSI Chart Bars red color;
- Signal Generator MA Crossing RSI downward above 50 level
- MACD downtrend
- Heiken Ashi chart red color
- Signal Trend red color
EXIT Position
- Profit Target 1:3 ratio stop loss,
- Use trailing stop,
- Initial stop loss on the previous swing.
What Goes into RSI?
The Relative Strength Index is going to measure price changes over the past X periods (with X being the input that you can enter into the indicator.)
- If you set RSI of 5 periods, it will measure the strength of this candles price movement against the previous 4 (for a total of the last 5 periods).
- If you use RSI at 55 periods, you will be measuring this candles strength or weakness to the last 54 periods.
The more periods you use, the ‘slower’ the indicator will appear to react to recent price changes.
 Top 10 Super Effective High Profits Forex Heiken Ashi Trading System and Strategy
 Super Effective Follow Trend Trading with Heiken Ashi Profit Supreme
 ZMA Heiken Ashi System – Easy Way To Identify The Direction Of The Trend
 Forex Trading Course – How To Trade Foreign Exchange Market With TREND SQUEEZER Heiken Ashi Trading System
 Learn Online Forex Trading – How To Easily Trade Forex With Heiken Ashi
 Best Forex & Binary Options 4 Hour Strategy with Heiken Ashi EMA Trend Following System
 How to Predict Forex Markets Accurately with Heiken Ashi BG, PCCI PRSI, and Momentum Indicator
 Forex Heiken Ashi Moving Average Trading System with Multi MACD and QQE Period Indicator (MACD)
 Heiken Ashi ADX System – Best Forex Trading Strategy for Consistent Profits
 Forex Success Trading in Super Simple Steps
