There are so many professional traders (both stock and forex traders) who rely on MACD indicator. Of course, we should not exaggerate about this indicator. It is not a magic tool to show you the buy/sell signals. However, compared to the other indicators, it is great. It can be used along with RSI to confirm the trade setups.

That is a million dollar question. Before we tell you why MACD works, we prefer to explain about one of the most important reasons of forex traders’ (and also all other kinds of traders’) failure.

Maybe you have heard this a lot from us, but it has to be reminded in this article too. Lack of patience is one of the most important reasons of forex traders’ failure.
Most traders are not patient enough to wait for a strong trade setup. After several minutes, hours or days that they wait for a trade setup (depend on the time frame or system they use), and they cannot locate any, they lose their patience and force themselves to take a position while there is no sharp and clear trade setup. So they lose.
On the other hand, when they succeed to take a good position, they get out too early with a small profit, because they are afraid of losing the profit they have already made. They do not have enough patience to hold a position until it hits the target. So they make their profit limited, because of lack of patience.
MACD is a solution for these problems, because it is delayed and this delay forces you to wait more, both when you are waiting for a trade setup, and when you are holding a position. That’s why MACD is recommended both by forex and stock traders.
Relative Strength Indicator (RSI) is a technical momentum indicator that compares the magnitude of recent gains to recent losses in an attempt to determine overbought and oversold conditions of an asset. It is calculated using the following formula:
RSI = 100 – 100/(1 + RS*)
*Where RS = Average of x days’ up closes / Average of x days’ down closes.
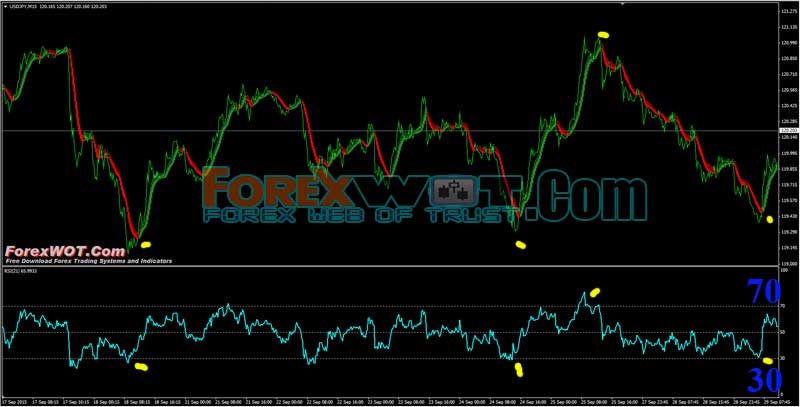
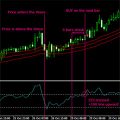
As you can see from the chart, the RSI ranges from 0 to 100. An asset is deemed to be overbought once the RSI approaches the 70 level, meaning that it may be getting overvalued and is a good candidate for a pullback. Likewise, if the RSI approaches 30, it is an indication that the asset may be getting oversold and therefore likely to become undervalued.
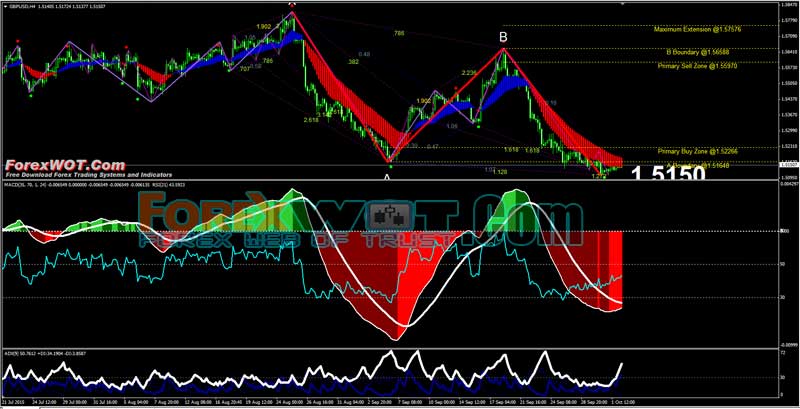
Gartley Pattern – In technical analysis, it is a complex price pattern based on Fibonacci numbers/ratios. It is used to determine buy and sell signals by measuring price retracements of a stock’s up and down movement in stock price.
The Gartley Patterns indicator automatically identifies and draws bearish and bullish Gartley patterns on the MT4 charts. It’s a price pattern based on Fibonacci numbers commonly used to enter buy and sell trades.

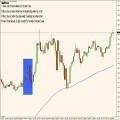
The above Gartley example shows an uptrend XA with a price reversal at A. Using Fibonacci ratios, the retracement AB should be 61.8% of the price range A minus X, as shown by line XB. At B, the price reverses again.
Ideally, retracement BC should be between 61.8% and 78.6% of the AB price range, not the length of the lines, and is shown along the line AC. At C, the price again reverses with retracement CD between 127% and 161.8% of the range BC and is shown along the line BD. Price D is the point to buy/sell (bullish/bearish Gartley pattern) as the price is about to increase/decrease.
 How Do I Become a Good and Prifitable Forex Trader
 Foreign Exchange Currency Trading & Investment Strategy – Forex Z 20 System for Successful and Highly Profitable Forex Trader
 High Accuracy Volty Channel Stop RSI Trading Strategy and How to Win Consistently in Forex Trading
 Forex and Crypto “MORNING TRADE” Trading Strategy for Advanced Traders
 Best Forex & Stocks Trading Strategy with Dolly-Graphics System
 High Probability Trading: The 10 Pips Forex Trading Strategy
 Forex Bill Williams Market Facilitation Index (BW MFI) Multi Trend Trading System and Strategy
 Forex Magic Breakout EMA CCI Trading – Maximize Your Profits and Achieve Exponential Earnings
 Sure Forex Breakout System Absolutely Amazing and Easy Forex Strategy
 Forex Breakout Trading Strategy with CCI and ADX
