FREE DOWNLOAD RMO Ichimoku Trend Monitor Forex Binary Options Trading System. This is a very easy and high accuracy Ichimoku Kinko Hyo trading system. This Ichimoku trading strategy is applicable for every trading instrument and timeframe.

Ichimoku Kinko Hyo was designed to be a chart in which you can see the balance of the market, at a glance. It is a trend following indicator, with a built-in support a resistance measurement.
The indicator is basically made up of four components, which are Moving Averages:
- Kijun Sen (Standard line): The (highest high + lowest low)/2 for the past 26 periods
- Tenkan Sen (Trigger line): The (highest high + lowest low)/2 for the past 9 periods
- Chikou Span (Lagging line): Current closing price time shifted backward 26 periods
- Kumo (or the cloud): It is made up of two components, the Senkou Spans A and B.
- Span A (first leading line) is calculated by (Tenkan Sen + Kijun Sen)/2, shifted forwards 26 periods.
- Span B (second leading line) is: (highest high + lowest low)/2 for the last 52 periods, also shifted 26 periods in the future.
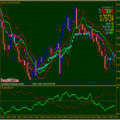
The default settings for the indicator are 9, 26, 52. This is what an Ichimoku chart looks like:
When do we actually enter trades with this indicator?…
The entry consists of three parts.
- First, we are looking for the Tenkan Sen and Kijun Sen to crossover.
- Second, we are looking for a confirmation break of the cloud in the corresponding direction.
- Finally, the Chikou Span should be below the price in a downtrend, or above price, in an uptrend.
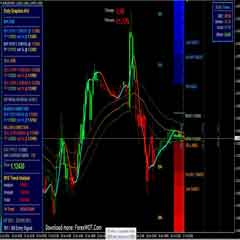
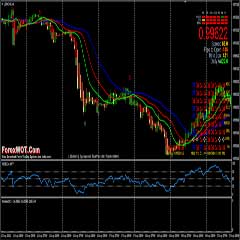
This can be hard to imagine with so many lines, so to simplify, in this trading system we only use Ichi360 Monitor Indicator as Ichimoku trend monitor tool. This is what an Ichi360 Monitor Indicator looks like:
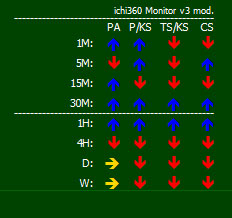
Very simple and easy to understand isn’t it?…
The Ichimoku indicator is a way to complex. I believe that there are simpler ways to trade. However, since many traders seem to use it successfully, it can be a viable option to explore.
In my opinion, RMO Ichimoku Trend Monitor Forex Binary Options Trading System is an easy and simple way to trade with Ichimoku Kinko Hyo. Remember to trade safe and test out any idea thoroughly before actually trading it.
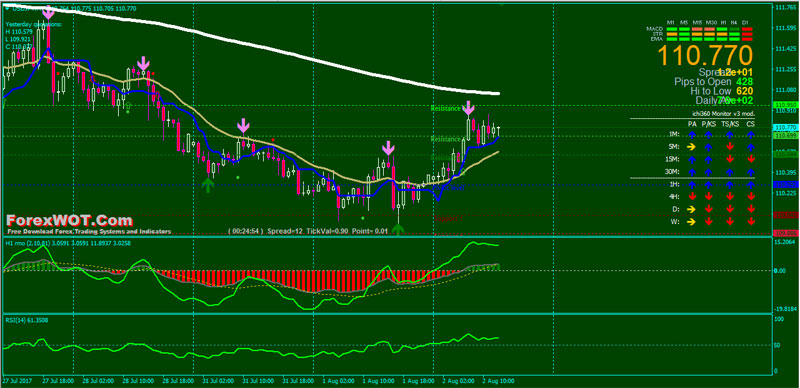
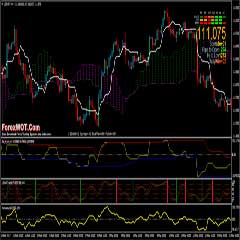
ForexWOT RMO Ichimoku Trend Monitor is a trend- momentum strategy. RMO is a Metastock indicator but here we have a modified version by Madlen with arrow.
RMO indicator is a gauge to market direction. It is displayed as a histogram. As a bullish “BUY” sign, we will look for the point at which the histogram shows movement crossing the oscillator’s zero level line going upwards. If it should go down and cross the line going down, that would be our “SELL” sign, or a “short-sell” sign.
- Best Time Frame: H1 and H4
- Recommended Currency Pairs: EURUD, GBPUSD, USDJPY, and all Major Pirs
- Ichi360 Monitor V3 Mod
- Tenkan-Sen line of Ichimoku Kinko Hyo
- RMO Signals
- Signal Trend
- Fibonacci Level
- Exponential Moving Average
- Relative Strength Index
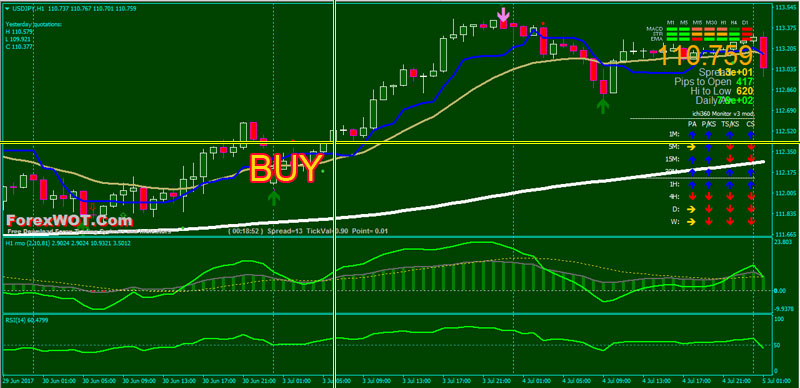
- Ichi360 Monitor V3 Mod Blue color arrow
- Price upward above Tenkan-Sen line of Ichimoku Kinko Hyo
- RMO Signals bullish (the histogram shows movement crossing the oscillator’s zero level line going upward)
- Green color bullish arrow OBOS indicator below the previous swing
- The candles above white line of Exponential Moving Average indicator
- Signal trend Green color bars

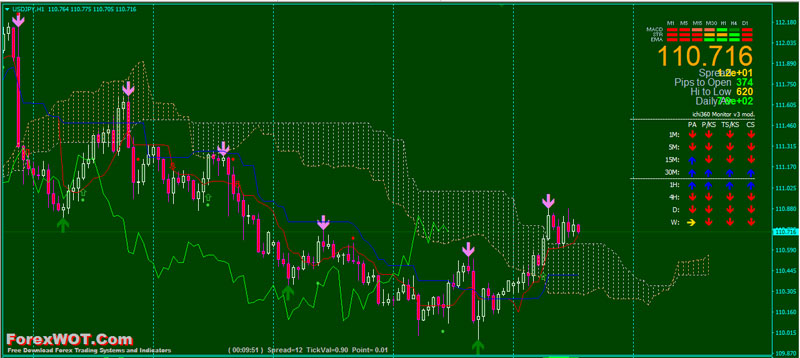
- Ichi360 Monitor V3 Mod Red color arrow
- Price downward below Tenkan-Sen line of Ichimoku Kinko Hyo
- RMO Signals bearish (the histogram shows movement crossing the oscillator’s zero level line going downward)
- Magenta Bullish OBOS arrow above the previous swing
- The candles below white line of Exponential Moving Average indicator
- Signal trend Red color bars
- Exit is discretionary based on @Fibo Level indicator
- This strategy works well also on Renko chart
[sociallocker]
[/sociallocker]
 How Do I Become a Good and Prifitable Forex Trader
 DOWNLOAD Top 7 Best Forex Ichimoku Trading System and Strategy
 Forex Vortex AMA System: An Easy Simple System for Growing Your Trading Account
 High Accuracy Volty Channel Stop RSI Trading Strategy and How to Win Consistently in Forex Trading
 Forex and Crypto “MORNING TRADE” Trading Strategy for Advanced Traders
 Best Forex & Stocks Trading Strategy with Dolly-Graphics System
 Forex Bill Williams Market Facilitation Index (BW MFI) Multi Trend Trading System and Strategy
 High Probability Trading: The 10 Pips Forex Trading Strategy
 IBS Reversal Ichimoku Trading System : How To Use Ichimoku Cloud To Trade Forex
 EASY Forex H1 IntraDay Trading System With Bill Williams Alligator Multi Trend Signal
