The “1-2-3 MACD Trading Strategy“. This strategy will take your trading to the next level, just by using MACD indicator and one simple price action pattern.

Once you train your eyes, you will see the signals all over the place. At the beginning of a new trend. At the end of a retracement. Within a trading range. Within rising or falling trend.
- Download “ForexWOT-123MACDsystem” (Zip/RAR File).
- Copy mq4 and ex4 files to your Metatrader Directory …/experts/indicators/
- Copy the “ForexWOT-123MACDsystem.tpl” file (template) to your Metatrader Directory …/templates /
- Start or restart your Metatrader Client.
- Select Chart and Timeframe where you want to test your forex system.
- Right-click on your trading chart and hover on “Template”.
- Move right to select “ForexWOT-123MACDsystem” trading system and strategy.
- You will see the “1-2-3 MACD System” is available on your Chart.
This scalping trading strategy is based on price action and simple market structure that any trader should know. The strategy is mostly used as a continuation trading setup that is designed to take advantage of the trend of the market, using a simple 1-2-3 pattern and MACD histogram.
And even though it is a continuation pattern upon confirmation, it can also be used as a reversal pattern from the short term trend direction.
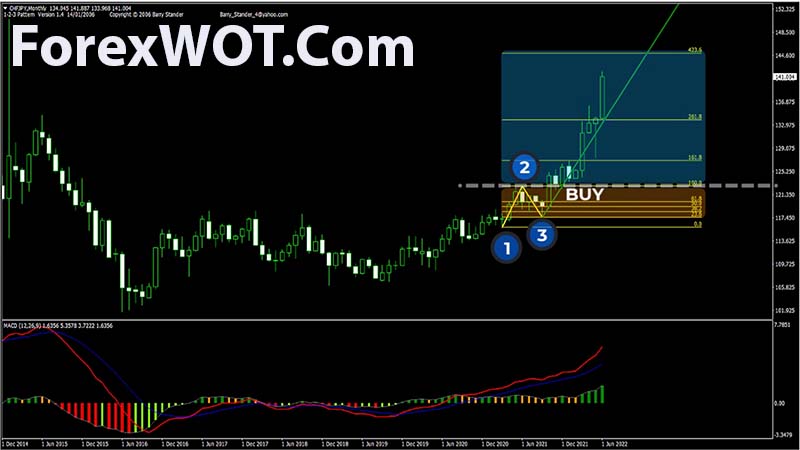
Here’s a long 1 2 3 pattern entry.
We identified point 1, and the first movement higher is point 2. This is followed by a retracement back lower that creates a higher low and point 3.
The 1 2 3 pattern is fully formed when price takes out the recent high of leg 2.
This is the time when we’ll make our breakout trade. But we need a confirmation, because if you take all signals, without context, you will slowly blow your account.
The key here is the MACD histrogram. For this long setup, during the formation of the third point, point 3, the MACD histogram must remain positive. It shouldn’t go below the 0-level. This is very important. This means the MACD decreased in height during the formation of point 3, but remained above zero line.
So even if the underlying momentum is getting weaker, it’s still positive momentum. And when price breaks point 2, then we can safely enter the trade, because during the correction, when point 3 was formed, bulls remained strong and maintained the upward momentum.
- Stop Loss
You should always secure your open trades with a stop loss order. Although the success rate of these patterns is relatively high, there is never a guarantee that the trade will work in your favor. Your stop loss is below the point 3.
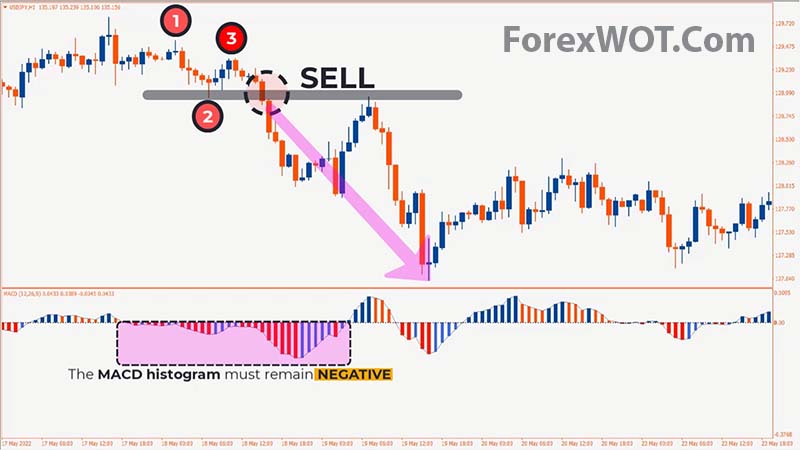
Here’s how you filter short signals using the 1 2 3 pattern and MACD histrogram.
We have a downtrend. Point 1 is the highest point when price finds resistance and moves down. Point 2 becomes a lower low point, and forms support.
Point 3 forms when the price moves up and forms a resistance. Remember that point 3 must be lower than the point 1. For this short setup, during the formation of the third point, point 3, the MACD histogram must remain negative. It shouldn’t go above the 0-level.
So during the formation of point 3, MACD increased in height, but remained below zero line. Even if the underlying momentum was increasing, was still negative momentum.
And when price broke point 2 downwards, we entered the trade, with the downward momentum on our side. The price breakout below point 2 support level indicates that the market is most likely to continue going down.
- Stop Loss
You should always secure your open trades with a stop loss order. Although the success rate of these patterns is relatively high, there is never a guarantee that the trade will work in your favor. Your stop loss is above the point 3 (swing high).
Your minimum target level during a 1 2 3 trade should be at a distance equal to the size of the 1 2 3 chart pattern. Applying it from the start of the confirmation level will give you an approximate minimum target level. The size of your 1 2 3 pattern equals the vertical distance between point 1 and point 2.


