80-period and 40-period EMA Trading Strategy with CCI and RSI Filter – This strategy is very simple and easy to find trading opportunities for all kind of traders. New traders do not need any analysis for applying this strategy. They need to follow the rules of this strategy and they earn pips easily.
An exponential moving average, or EMA, is a type of moving average that places a greater weight and significance on the most recent data points.
The Exponential Moving Average is also referred to as the exponentially weighted moving average. An exponentially weighted moving average reacts more significantly to recent price changes than a simple moving average or SMA, which applies an equal weight to all observations in the period.
The 40-period and 80-period Exponential Moving Averages, or EMAs, are often the most quoted and analyzed short-term averages. In general, the 40-period and 80-period EMAs are used as indicator for long-term trends.
So, when an asset price crosses its 80-period moving average, it is a technical signal that a reversal has occurred.
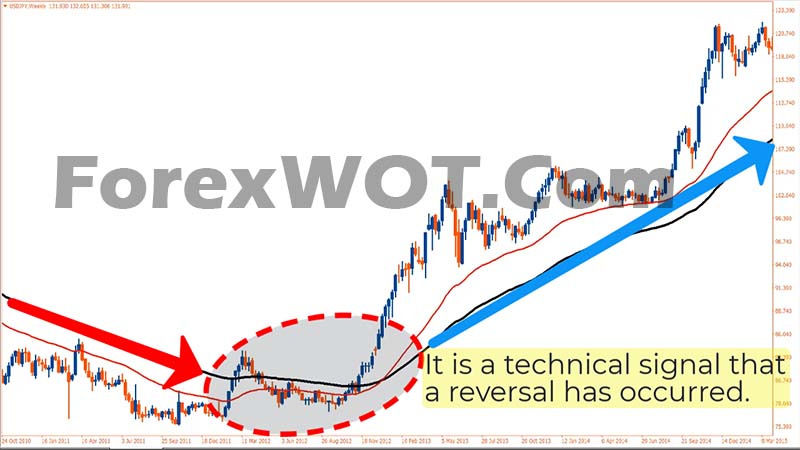
Traders who employ technical analysis find moving averages very useful and insightful when applied correctly. However, they also realize that these signals can create havoc when used improperly, or misinterpreted. All the moving averages commonly used in technical analysis are lagging indicators.
- Download “ForexWOT-EMAsystemRSICCIfilter” (Zip/RAR File).
- Copy mq4 and ex4 files to your Metatrader Directory …/experts/indicators/
- Copy the “ForexWOT-EMAsystemRSICCIfilter.tpl” file (template) to your Metatrader Directory …/templates /
- Start or restart your Metatrader Client.
- Select Chart and Timeframe where you want to test your forex system.
- Right-click on your trading chart and hover on “Template”.
- Move right to select “ForexWOT-EMAsystemRSICCIfilter” trading system and strategy.
- You will see the “80-40 EMA System with RSI-CCI Filter” is available on your Chart.
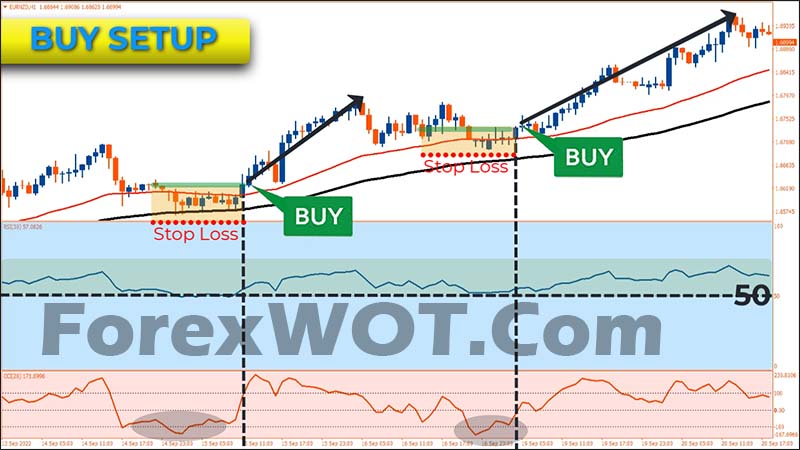
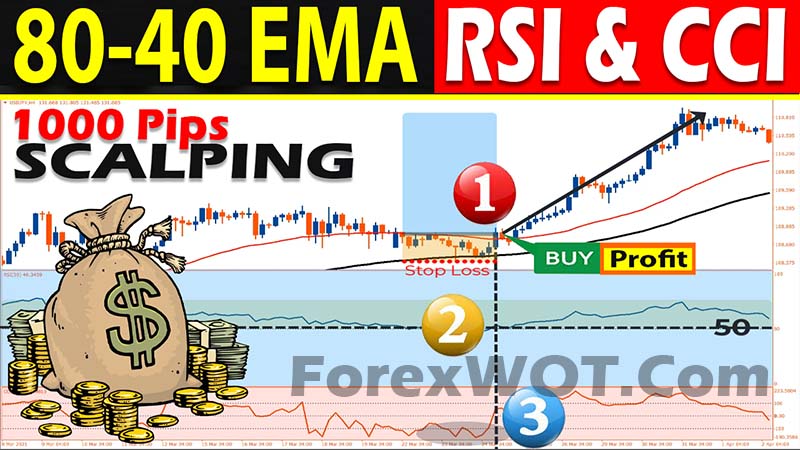
Buy Set up While Using EMA, RSI and CCI indicators.
A trader should only consider entering a long position or buy, when.
- 1st. The 40-period above the 80-period EMA.
- 2nd. The 30-period RSI reading is above 50. Such a reading indicates an underlying upward momentum in the price of the underlying security. In this case, traders should only consider long positions.
The “80-period and 40-period EMA” zone, and CCI indicator will, in this case, help in generating signals for opening long positions. For a buy signal,
- 1st. When price moves down to “the 80-period and 40-period EMA” zone, traders can use this as a signal that price might stop or retrace at that point.
- 2nd. Turn to a 20-period CCI, and look for when the indicator crosses -100 from below. Whenever this happens, then it would be wise to enter long positions.
A stop-loss can be placed a few pips below the swing low.
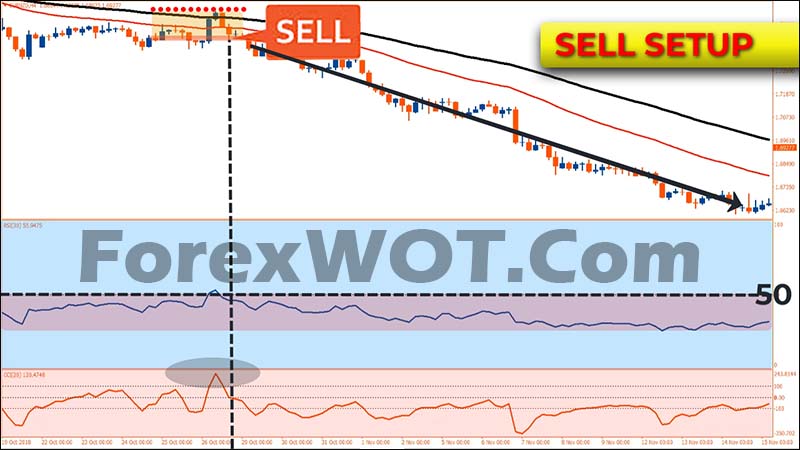
SELL Set up While Using EMA, RSI and CCI indicators.
A trader should only consider entering a short position or sell, when.
- 1st. The 40-period below the 80-period EMA.
- 2nd. The 30-period RSI reading is below 50. whenever the 30-period RSI indicator is below the 50 line the same indicates the underlying price has turned bearish, and that price is likely to continue edging lower.
In this case, traders should only consider short positions. A signal to enter short positions will happen when,
- 1st. When price moves up to “the 80-period and 40-period EMA” zone, traders can use this as a signal that price might stop or retrace at that point.
- 2nd. the 20-period CCI indicator crosses the +100 mark from above.
A stop-loss can be placed a few pips above the swing high.
RSI and CCI are some of the best trading instruments given their ability to shed light on overbought and oversold conditions. When used together with Exponential Moving Average, the RSI and CCI indicators can aid in ascertaining ideal entry and exit points perfect for mitigating losses and optimizing profits.


