I will share with you is a simple, effective fractal strategy that avoids these common pitfalls and enhances your chances of success in the market.

As you may already know, the traditional use of the fractal indicator often fails because it generates too many entry signals in a short amount of time, leading to confusion and missed opportunities.
However, the fractal trading strategy I’m about to share with you is different, it’s more refined and much more effective. I’ll walk you through exactly how to use it, step by step, to avoid the common mistakes that many traders make.
- Download “ForexWOT-FractalsMagicSystem” (Zip/RAR File).
- Copy mq4 and ex4 files to your Metatrader Directory …/experts/indicators/
- Copy the “ForexWOT-FractalsMagicSystem.tpl” file (template) to your Metatrader Directory …/templates /
- Start or restart your Metatrader Client.
- Select Chart and Timeframe where you want to test your forex system.
- Right-click on your trading chart and hover on “Template”.
- Move right to select “ForexWOT-FractalsMagicSystem” trading system and strategy.
- You will see the “ForexWOT-FractalsMagicSystem” is available on your Chart.
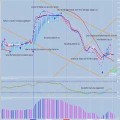
To enhance the effectiveness of the fractal breakout strategy, we can incorporate 200-period moving average and 14-period moving average to determine the long-term and short-term trend direction. The 200-period moving average is widely recognized as a key indicator in trend-following strategies. When the price is trading above this moving average, it suggests that the market is in an uptrend, while price trading below it indicates a downtrend. This simple filter helps you align your trades with the prevailing trend, increasing the likelihood of success.
Now, let’s break down the modified fractal breakout strategy.
While these analysis rules may seem straightforward, it’s crucial not to overlook any of them as it could undermine the accuracy of this strategy.
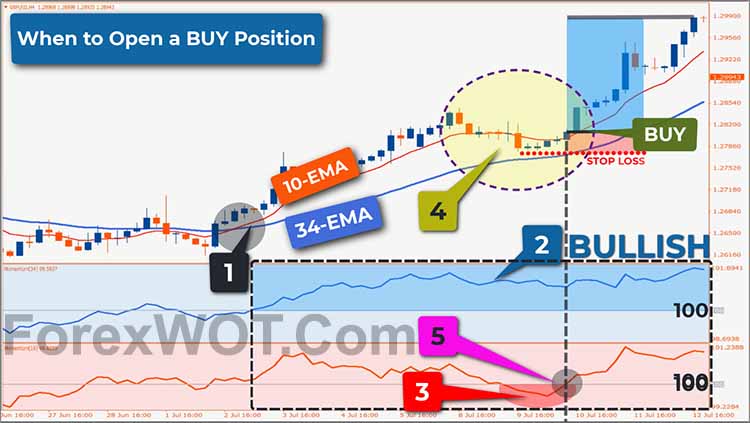
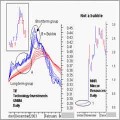
- The first rule is to identify a clear trend. As I explained earlier in the video, clear signs of a bullish trend include the 10-period EMA above the 34-period EMA with both EMAs sloping upwards. As you can see on this chart, both bullish criteria are met, confirming that the market is in a bullish condition.
- Secondly, the 34-period MOMENTUM line is above the 100 level. This indicates strong market strength for maintaining the bullish trend based on momentum analysis.
- Thirdly, the 10-period MOMENTUM line dips below the 100 level while the 34-period MOMENTUM line remains above it.
- Fourthly, the 10-period EMA stays above the 34-period EMA when prices correct into the zone between these two lines.
- Fifthly, open a BUY position on the next candle if the 10-period MOMENTUM line rises above the 100 level.
- Sixthly, place a stop loss below the nearest swing low. However, if the distance between the BUY entry and the nearest swing low is too close, consider placing the stop loss below the 35-period EMA line.
To enhance the effectiveness of the fractal breakout strategy, we can incorporate 200-period moving average and 14-period moving average to determine the long-term and short-term trend direction.
The 200-period moving average is widely recognized as a key indicator in trend-following strategies.
When the price is trading above this moving average, it suggests that the market is in an uptrend, while price trading below it indicates a downtrend. This simple filter helps you align your trades with the prevailing trend, increasing the likelihood of success.
Now, let’s break down the modified fractal breakout strategy.
My message is clear: you must adhere to every rule outlined to maintain the accuracy of this strategy.
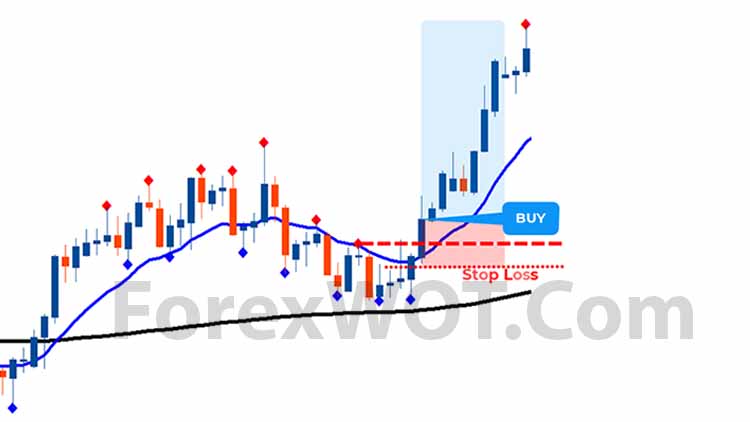
- If the price is above the 200-period moving average, it indicates that the overall market sentiment is bullish.
- The best time to enter the market is when the price continues its bullish trend after undergoing a correction phase indicated by the price moving down and below the 14-period Moving Average line.It should be noted that in this correction phase, when the up fractal arrow appears on a candle, you do not immediately enter the trade. Instead, you wait for confirmation by watching for the price to break above the 14-period Moving Average line and break above the high of the candle where the up fractal arrow appeared.
- Once the price breaks and closes above that high, your buy entry is triggered at the close of the breakout candle.
- To manage risk effectively, place your stop loss below the 14-period Moving Average line. This ensures that if the market moves against your position, your losses are limited.
By combining the 200-period moving average, 14-period Moving Average with fractal breakout signals, you’re adding a layer of trend confirmation to the strategy, which filters out trades that go against the broader market direction.
This approach not only improves the accuracy of your trades but also reduces the risk of getting caught in false breakouts.
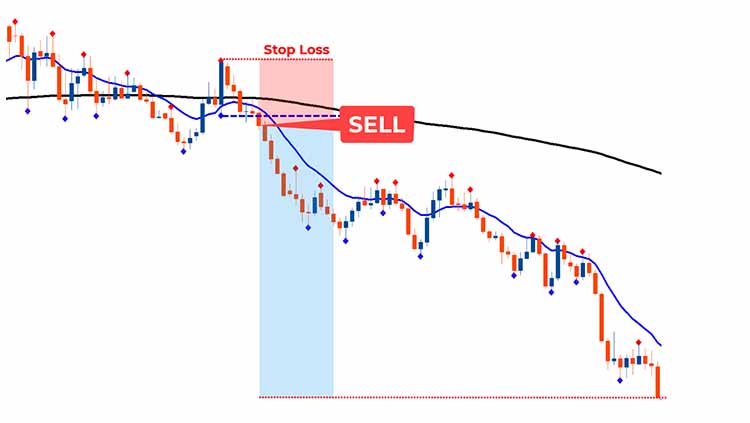
- If the price is below the 200-period moving average, it indicates that the overall market sentiment is bullish.
- The best time to enter the market is when the price continues its bearish trend after undergoing a correction phase indicated by the price moving up and above the 14-period Moving Average line. It should be noted that in this correction phase, when the down fractal arrow appears below a candle, you do not immediately enter the trade. Instead, you wait for confirmation by watching for the price to break below the 14-period Moving Average line and break below the low of the candle where the down fractal arrow appeared.
- Once the price breaks and closes below that low, your sell entry is triggered at the close of the breakout candle.
- To manage risk effectively, place your stop loss above the 14-period Moving Average line. This ensures that if the market moves against your position, your losses are limited.
This strategy is very accurate if you follow the trading rules that we discussed earlier. If these rules are not clearly met in the market, you should not enter the market.
You’ll find that this strategy is easy to implement on your own because it’s quite simple.
 2 MACD Effortless Forex & Stocks Swing Trading Strategy
 MA COBRA Forex & Stocks Trading Strategy (Extremely Low Risk High Reward Trading Strategy) (COBRA SYSTEM)
 Foreign Exchange Trading : Online Forex Master Level Trading System and Strategy
 FREE DOWNLOAD 20+ Best Forex MACD-Moving Average Trading System
 Stocks and Currency Trading With GUPPY Multiple Moving Averages Trading System
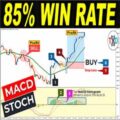 Best LWMA Trading With MACD & STOCHASTIC Filter
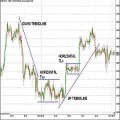 How to Do Accurate Forex Trend Line Analysis
 TOP 10 Best Bollinger Bands Forex Trading System and Strategy
 TOP10 BEST Full Time Forex Trader Trading System and Strategy
 Forex Trend Trading Tricks Of The Successful Forex Trader
