WEDGE PATTERNS Trend line Breakout. The Only Breakout Trading Strategy You Will Ever Need. This breakout trading strategy, which I’ve employed for several years, has become my favored approach due to its reliability and the consistently favorable risk-to-reward ratios it offers.
This strategy comprises four key elements:
- Support
- Resistance
- Breakout
- Retest
In this strategy we only have two trend lines. One trend line acts as support while the other acts as resistance. This forms what is known as a ‘wedge pattern‘.
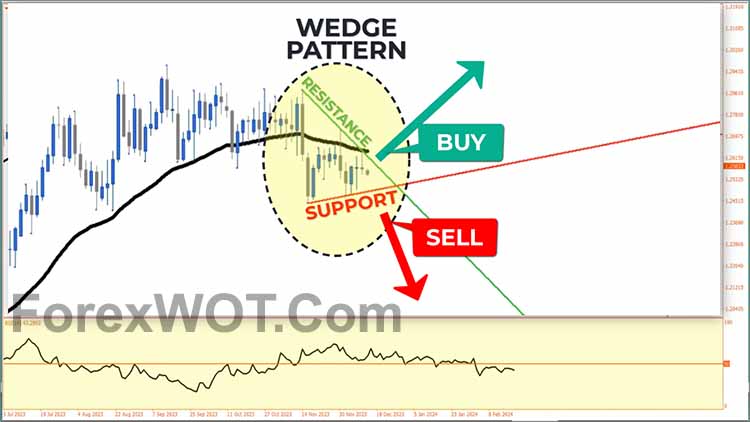
The breakout of this pattern occurs when the market finally breaks out to one side or the other.
Although novice traders tend to trade the “wedge” pattern based on whichever direction the market moves. In other words, they let the market show its ability before considering opening a BUY or SELL position without analyzing other factors. This is certainly very risky and careless.
In fact, the wedge is a continuation pattern of the market trend. Therefore, I tend to trade it based on whichever direction is prevailing when the “wedge” pattern forms.
Now, let’s apply this pattern to the chart for further clarification.
- Download “ForexWOT-WedgePatternSystem” (Zip/RAR File).
- Copy mq4 and ex4 files to your Metatrader Directory …/experts/indicators/
- Copy the “ForexWOT-WedgePatternSystem.tpl” file (template) to your Metatrader Directory …/templates /
- Start or restart your Metatrader Client.
- Select Chart and Timeframe where you want to test your forex system.
- Right-click on your trading chart and hover on “Template”.
- Move right to select “ForexWOT-WedgePatternSystem” trading system and strategy.
- You will see the “ForexWOT-WedgePatternSystem” is available on your Chart.
On this chart, the market is currently in a bullish trend as indicated by the upward slope of the Moving Average line and the price is above the Moving Average line. Another confirming factor is the RSI line which is above the 50 level, indicating a definite bullish trend in the market.
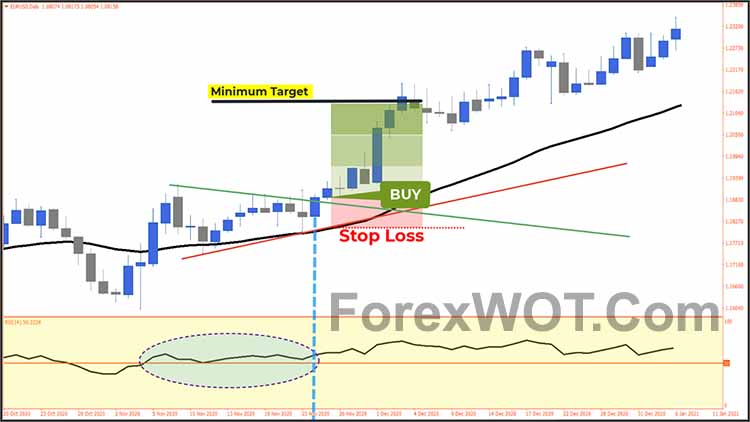
We now observe a strong bullish candle breaking through the ‘resistance wedge’, followed by the RSI line, which was previously above the 50 level, now rising further, indicating an intensification of the bullish trend.
As always, This is a strong BUY signal with a very high probability of success. This bullish breakout phase provides an opportunity to initiate a long position, with the recommended stop loss placed below the last swing low or the end of the Moving Average Line.
Setting Targets
Now that we have identified entry points and stop loss points, let’s turn our attention to target setting. As you probably know, I recommend using live price action levels, setting profit targets with reference to previous support or resistance levels. Alternatively, I directly set a profit target based on the 1:3 Risk to Reward Ratio rule.
In this chart, the market is currently in a bearish trend, indicated by the downward slope of the Moving Average line and the price is below the Moving Average line. Another confirming factor is the RSI line being below the 50-level mark, indicating a definitive bearish trend in the market.
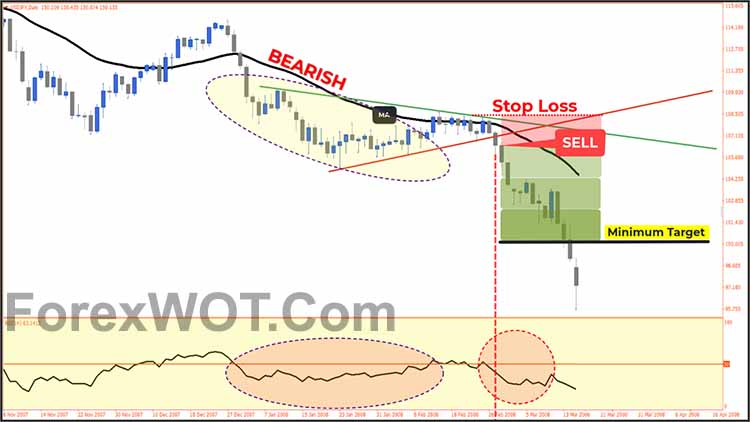
We observe a robust bearish candle breaking through the ‘support wedge,’ followed by the RSI line, previously below the 50-level, now descending further, signifying an intensification of the bearish trend.
This constitutes a compelling SELL signal with a notably high probability of success. The breakout phase provides an opportunity to initiate a short position, with a recommended stop loss positioned above the last swing high or the peak of the Moving Average Line.
Establishing Targets
Now that we’ve identified entry and stop-loss points, let’s turn our attention to setting targets. As you may be aware, I advocate for the use of straightforward price action levels, taking profits at prior support or resistance levels. Alternatively, a method favored by professional traders involves establishing a profit target based on the 1:3 Risk to Reward Ratio rule.
This strategy consistently yields satisfactory results.
What is the best breakout strategy?
Something simple like a wedge or channel break is my preferred method for trading breakouts. Just keep in mind that no two traders are alike, which means the “best” strategy is the one that works best for you.
Are breakout strategies reliable?
Just keep in mind that no two traders are alike, which means the “best” strategy is the one that works best for you. As long as you take the time to develop a trading edge and stay patient, breakout strategies like the one taught here can be reliable and incredibly profitable.
What is the best time frame to trade breakouts?
It’s subjective, but I have found the 4-hour and daily time frames to perform the best when trading breakouts.


