ADVANCED ICHIMOKU Trading Strategy (Advanced Simplified Ichimoku Trading Strategy). This is one of the best trading strategies as it analyzes all the technical market conditions required by every trader before opening positions.
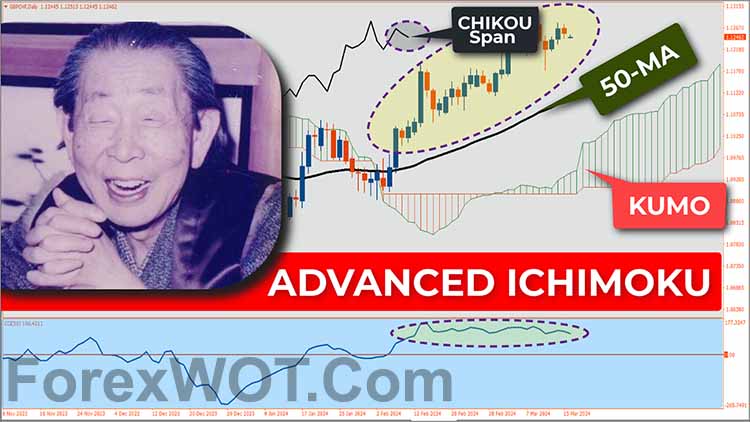
In this strategy, traders will quickly and easily determine market trends. By utilizing the KUMO and 50-period Moving Average rules, it has been explained that:
- If the price is above the KUMO, and the chikou span line is above the candle, then the market is assumed to be bullish.
- Conversely, if the price is below the KUMO, and the chikou span line is below the candle, then the market is assumed to be bearish.
The next step in the Advanced Simplified Ichimoku Trading Strategy is to also use the 50-period Moving Average line. So,
- If the price is above the 50-period Moving Average, then the market is in a bullish condition.
- Conversely, if the price is below the 50-period Moving Average, then the market is in a bearish condition.
What needs to be noted with the 50-period Moving Average line is that when combined with the KUMO BUY signal, it is said to be valid
- If the 50-period Moving Average line is above the KUMO.
- Conversely, the SELL signal is said to be valid if the 50-period Moving Average line is below the KUMO.
The next confirmation is by utilizing the information provided by the CCI indicator. What needs to be noted in this strategy is that the CCI must be set to a period of 50. The period of 50 is the period used by the moving average to determine market trends.
- So, if the 50-period CCI line is above the level 0, then the market is in a bullish trend.
- Conversely, the market is said to be bearish if the 50-period CCI line is below the level 50.
Alright, let’s move on to implementing the use of this trading strategy.
In this example, I will show you the price movement conditions that meet the criteria set according to the trading rules we just discussed.
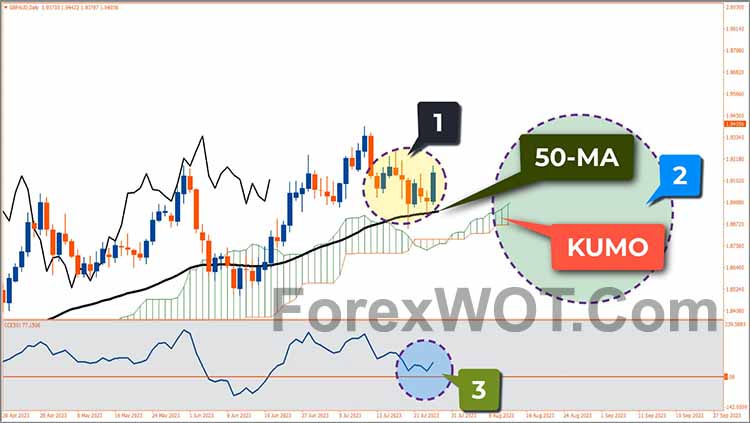
- 1st. The market trend is bullish as indicated by 1st. the price is above the kumo and the 50-period moving average line.
- 2nd. The 50-period moving average is above the KUMO.
- 3rd. The 50-period CCI line is above level 0.
If all three rules are met, then the trader only needs to wait for the market to correct until the price approaches the 50-period moving average line.
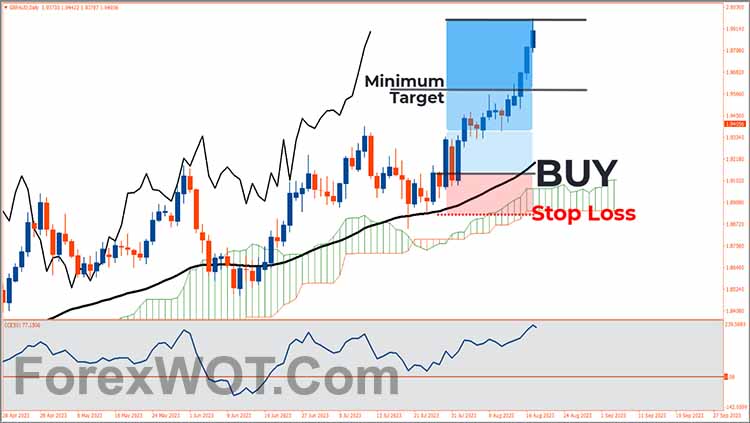
If the price forms a bullish price action pattern such as in this case, the appearance of a bullish engulfing, then the trader should immediately open a BUY position at the opening of the next candle.
Don’t forget to place a stop loss below the nearest swing low or below the moving average line. The minimum profit target is 2 times the stop loss.
As you can see, this is a very simple trading strategy based on the Ichimoku indicator. This strategy is much easier to understand and less complicated compared to conventional Ichimoku strategies.
However, its accuracy is much better than conventional Ichimoku strategy. It is proven, the price immediately continues its trend quite quickly after we open a BUY position.
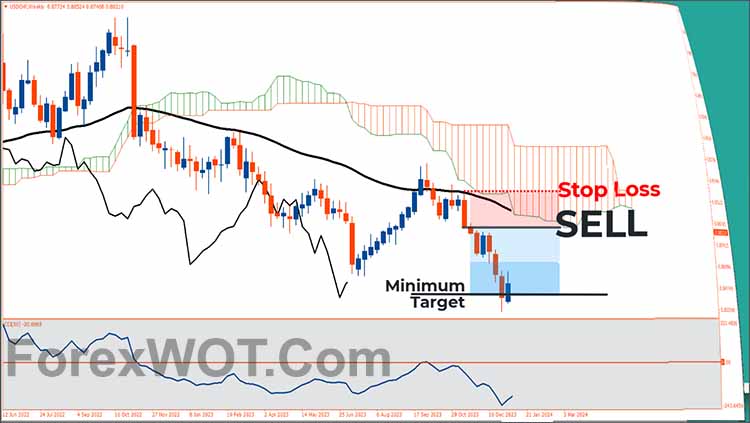
For a sell entry, it is advisable that
- 1st. The market trend is bearish as indicated by 1st. the price is below the kumo and the 50-period moving average line.
- 2nd. The 50-period moving average is below the KUMO.
- 3rd. The 50-period CCI line is below level 0.
If all three rules are met, then the trader only needs to wait for the market to correct until the price approaches the 50-period moving average line.
If the price forms a bearish price action pattern such as in this case, the appearance of a bearish engulfing, then the trader should immediately open a SELL position at the opening of the next candle.
Don’t forget to place a stop loss above the nearest swing high or above the moving average line.
The minimum profit target is 2 times the stop loss. Just like in the previous example, the price immediately continues its trend quite quickly after we open a SELL position.
This is one of the best trading strategies as it analyzes all the technical market conditions required by every trader before opening positions.
In this strategy, traders will quickly and easily determine market trends. By utilizing the KUMO and 50-period Moving Average rules, it has been explained that if the price is above the KUMO, and the chikou span line is above the candle, then the market is assumed to be bullish. Conversely, if the price is below the KUMO, and the chikou span line is below the candle, then the market is assumed to be bearish.


