MACD – Bollinger Band Forex Trading Systems and Indicators (The Sea Trading System ). Today, I want to share with you a unique trading system which I call, the Sea Trading System. That’s because the signals occur when every indicator involved falls below its middle level, which looks like a sea level.
This system can be traded on every timeframe available and can bring you good gains if the rules are followed correctly.
Timeframe:
All timeframes
Currency Pairs:
Major pairs such as the EUR/USD and the GBP/USD.
Indicators:
- Bollinger Bands (20,3)
- 3 period Exponential Moving Average (EMA)
- Moving Average Convergence Divergence (MACD) – 6,17,1
- 14 period Relative Strength Index (RSI)
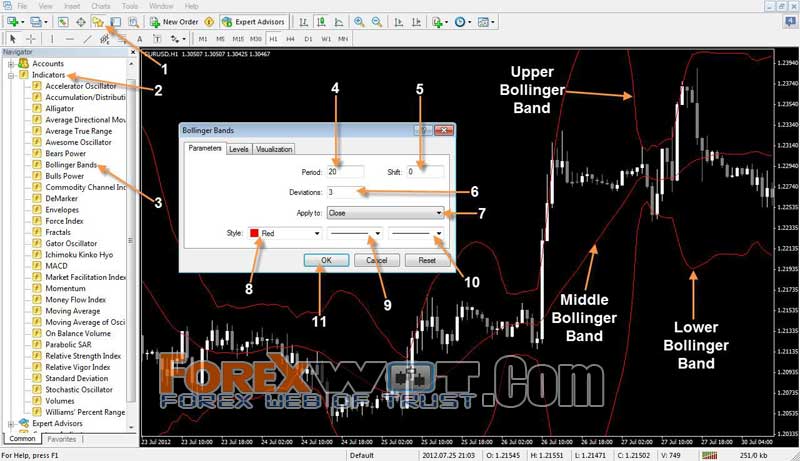
- Click on the Navigator button to open the Navigator widow.
- Click on Indicators to expand the list of indicators.
- Find Bollinger Bands on the list and double click on it.
- Set the Period to 20.
- Leave the Shift at 0.
- Set the Deviation to 3.
- Leave the Apply to section at the default value, Close.
- Click Style and choose Red for the color of your indicator.
- Leave the line type as it is by default.
- This is for setting the indicator’s line width.
- Click on the OK button to apply the Bollinger Band indicator on your chart.
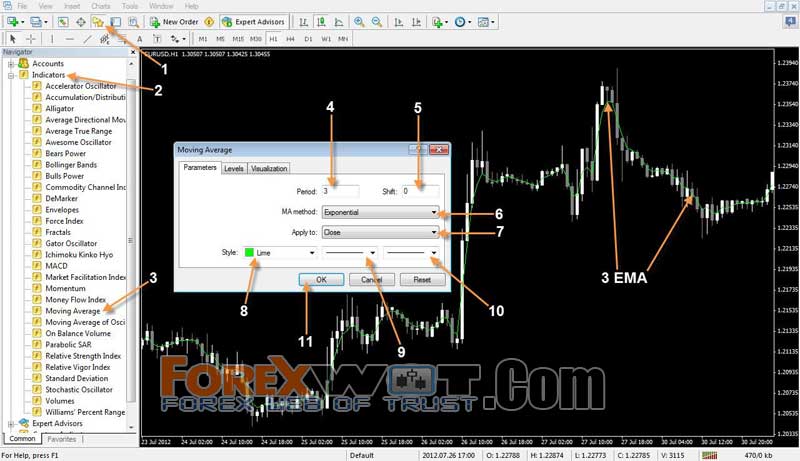
- Click on the Navigator button to open the Navigator widow.
- Click on Indicators to expand the list of indicators.
- Find Moving Averages on the list and double click on it.
- Set the Period at 3.
- Leave Shift at 0.
- Click on the MA method drop down menu and select Exponential.
- Leave the Apply to section at the default value, Close.
- Click Style and choose Lime as the color for your indicator.
- Leave the line type as it is by default.
- This is for setting the indicator line width.
- Click on the OK button to apply the 14 SMA on your chart.
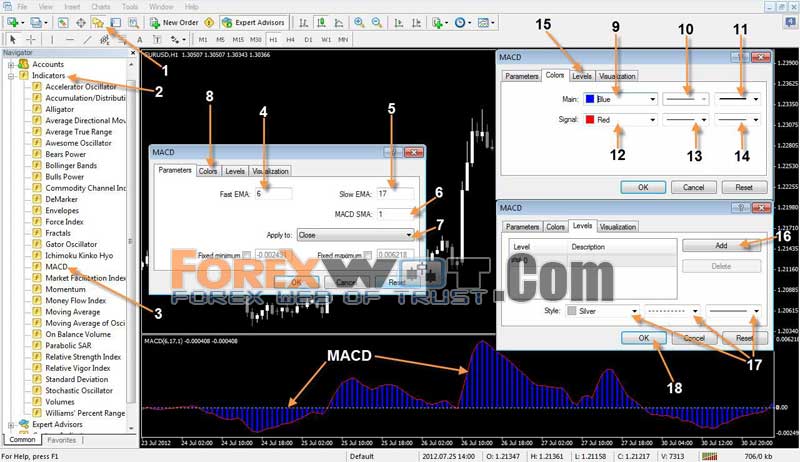
- Click on the Navigator button to open the Navigator widow.
- Click on Indicators to expand the list of indicators.
- Find MACD on the list and double click on it.
- Set the Fast EMA at 6.
- Set the Slow EMA at 17.
- Set the MACD SMA at 1.
- Leave the Apply to at Close (default).
- Click on the Colors tab.
- On the Main dropdown menu, choose Blue as the color of the histogram.
- This is for setting the MACD histogram line type.
- This is for setting the MACD histogram bar’s width.
- Click on the Signal dropdown menu and chose Red as the color of your indicator Signal line.
- This is for setting the Signal line type.
- This is for setting the Signal line width.
- Click on the Levels tab.
- Click on the Add button and a 0 level will appear on the left side of the box.
- Here you can customize the level color, line type and width. Leave all of them as they are by default.
- Click on the OK button to apply the MACD indicator on your chart.
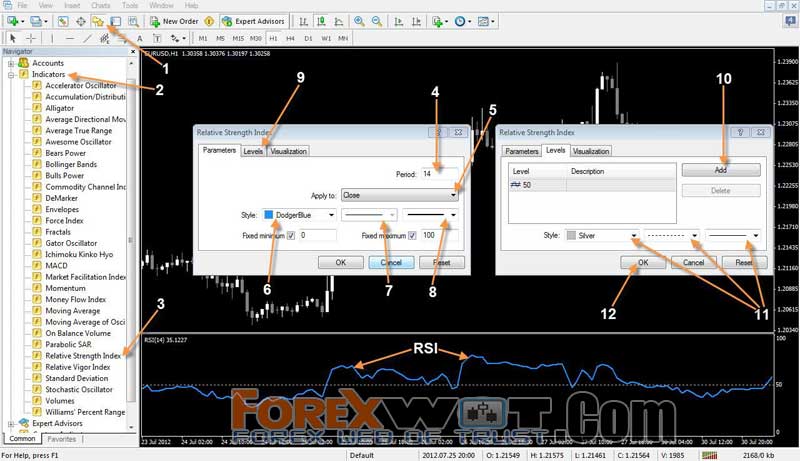
- Click on the Navigator button to open the Navigator widow. (1)
- Click on Indicators to expand the list of indicators. (2)
- Find Relative Strength Index (RSI) on the list and double click on it. (3)
- Leave the Period at 14 as it is by default. (4)
- Leave the Apply to section at the default value, Close. (5)
- Click Style and select DodgerBlue as the color of the indicator (5).
- Leave the line type as it is by default. (7)
- This is for setting the line width. (8)
- Click on the Levels tab. (9)
- Click on the Add button and enter 50 for the level. (10)
- Here you can customize the level color, line type and width (11). Leave all of them as they are by default.
- Click on the OK button to apply the RSI on your chart. (12)
- The 3 period EMA must cross above the Middle Bollinger Band.
- The MACD must cross above the 0 level.
- The 14 period RSI must cross above the 50 level.
- When all the conditions above are met, place a buy order.
- Set the Stop Loss a few pips below the nearest swing low or the Lower Bollinger Band, whichever is closer.
- Set the Take Profit at the Upper Bollinger Band or use a fixed profit target, depending on the timeframe you are trading. Here are some examples of fixed Take Profit targets in pips for each timeframe:
- M1 (1 minute): 3-5 pips
- M5 (5 minute): 5-10 pips
- M15 (15 minutes): 15-20 pips
- M30 (30 minutes): 25-30 pips
- H1 (1 hour): 40-60 pips
- H4 (4 hours): 80-100 pips
- D1 (Daily): 150-200 pips
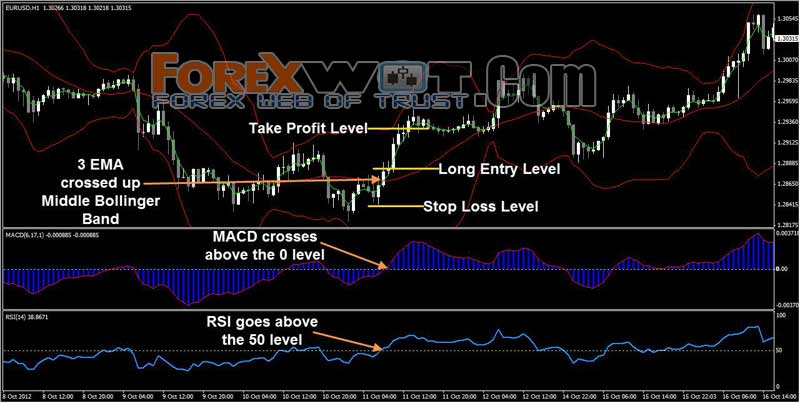
Let’s have a look at a long trade example on the next page
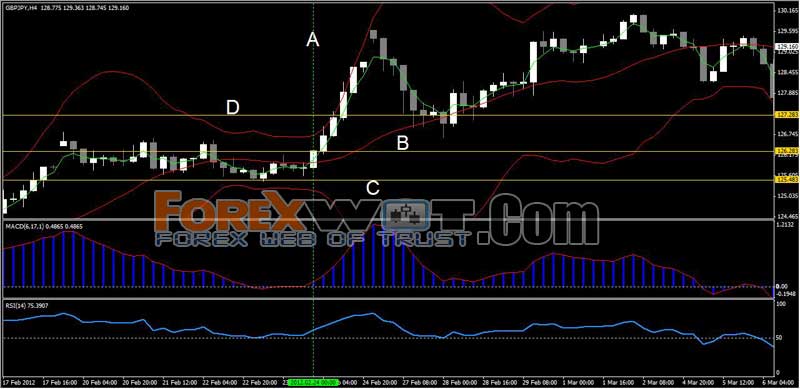
Above, we have long trade taken on GBP/JPY H4 chart along the vertical line (A). Prior to the entry, when the RSI crossed above the 50 level, we got the first sign to start looking for long trade. The MACD also crossed above the 0 level. A few candles later the 3 EMA crossed above the Middle Bollinger Band.
After the close of the current set up candle, a long position was opened at 126.283 (B). Then, a Stop Loss of 80 pips under the entry was set, just below the last swing low point at 125.483 (C).
Next, a Take Profit Target of 100 pips was set at 127.283 (D), which was hit right at the very next candle.
Now let’s take a look at Short trade conditions.
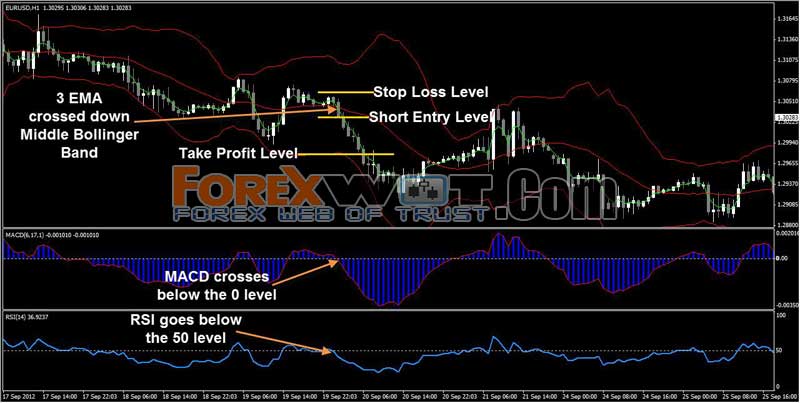
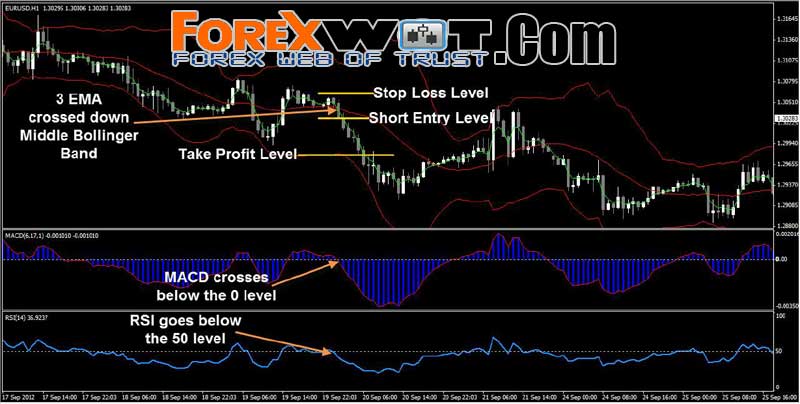
- The 3 period EMA must cross under the Middle Bollinger Band.
- The MACD must fall below the 0 level.
- The 14 period RSI must move below the 50 level.
- When all the conditions above are met, place a sell order.
- Set the Stop Loss a few pips above the nearest swing high or the Upper Bollinger Band, whichever is closer.
- Set the Take Profit at the Lower Bollinger Band or a fixed target, depending on the timeframe you are trading.
Let’s take a look at a short trade example on the next image.
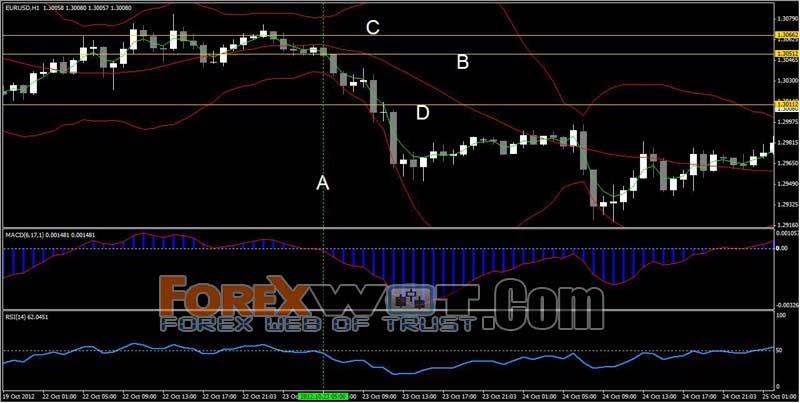
Here, we have a short trade on the EUR/USD H1 chart, along the vertical line (A). First, the RSI crossed below the 50 level and almost simultaneously, the 3 EMA crossed below the Middle Bollinger Band. The last signal was given by the MACD when it fell under the 0 level.
Immediately after the close of the setup candle, a short trade was placed at 1.30512 (B).
Next, a Stop Loss of 15 pips above the entry was set, at 1.30662, which is just above the last swing high (C).
And then, a Take Profit of 40 pips was set at 1.30112 (D). As you can see, the Take Profit was hit 4 hours later.


you said all tf can, but what are the BEST tf you trade?
hello, can I use this method with other major pairs such as Gold, AudUsd, UsdCad and UsdJpy???
Hi Mehdi Hasan, USDJPY is a good pair to