Trading System With Such a High Winning Percentage. In this report, I will show you a trading system with such a high winning percentage that it deserves to be called a “Golden” strategy.
One of the major advantages of the Golden Strategy is that it can be traded on every timeframe available to you. If you don’t have enough time to spend in front of your computer, you can trade lower timeframes like the M1 (1 minute) and the M5 (5 minute).

On the other hand, if you are not under pressure to go to work and can monitor your trade every couple of hours, then trading the H1 (1 hour) and the H4 (4 hour) timeframes is for you.
Timeframe: All timeframes
Currency Pairs: Major pairs like the EUR/USD and the GBP/USD.
Indicators:
- 55 Smoothed Moving Average (SMMA) – set to High price.
- 55 Smoothed Moving Average (SMMA) – set to Low price.
- 55 period Williams’ Percent Range (%R) – levels set at -25 and -75 values.
- Stochastic Oscillator – %K period = 5, Slowing = 5, %D period = 5, Price field = Low/High, MA method = Simple, with levels at 20 and 80 (default).
1. 55 period SMMA (Smoothed Moving Average) – set to High price.
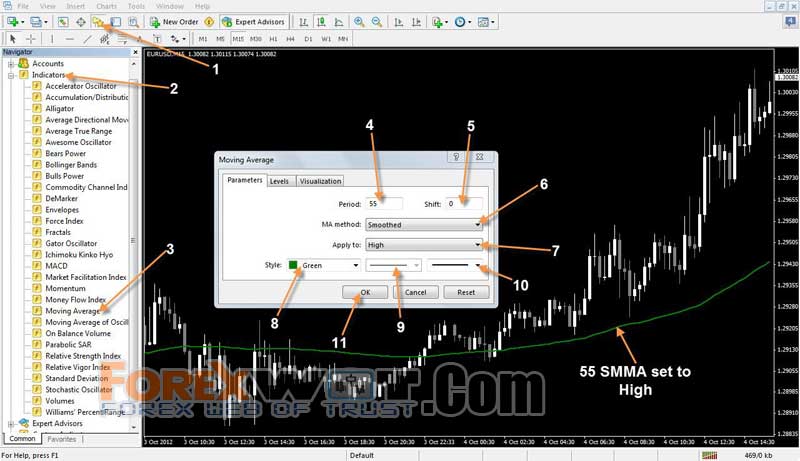
- Click on the Navigator button to open the Navigator widow.
- Click on Indicators to expand the list of indicators.
- Find Moving Averages on the list and double click on it. The settings dialogue box will pop up.
- Set the Period at 55.
- Leave Shift at 0.
- Click on the MA method drop down menu and select Smoothed.
- Click on the Apply to drop down menu and select High.
- Click Style and choose the color for your 55 SMMA. On this chart, we are using Green.
- Leave the line type as it is by default.
- Set the 55 SMMA line width here.
- Click on the OK button to apply the 55 SMMA on your chart.
2. 55 period SMMA (Smoothed Moving Average) – set to Low price.
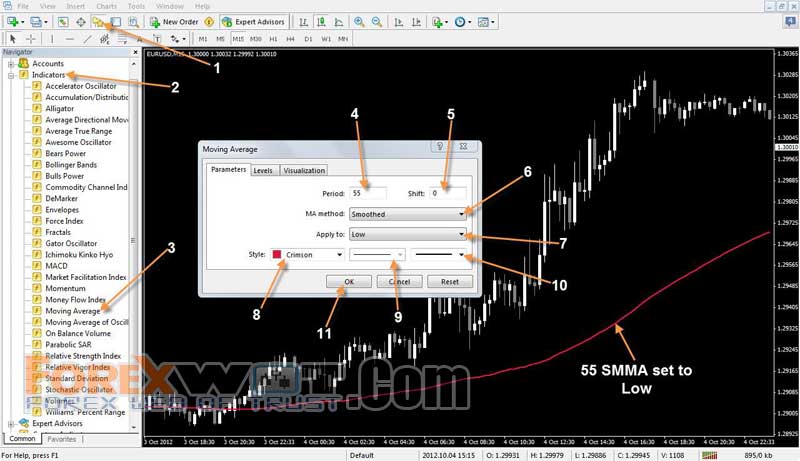
Basically, the steps for adding the 55 SMMA set to Low are the same as for 55 SMMA set to High. Just follow the same steps but set a different color and Apply to Low. On this chart, we are using the Crimson color.
3. 55 period Williams’ Percent Range (%R) – levels set at -25 and -75 values.
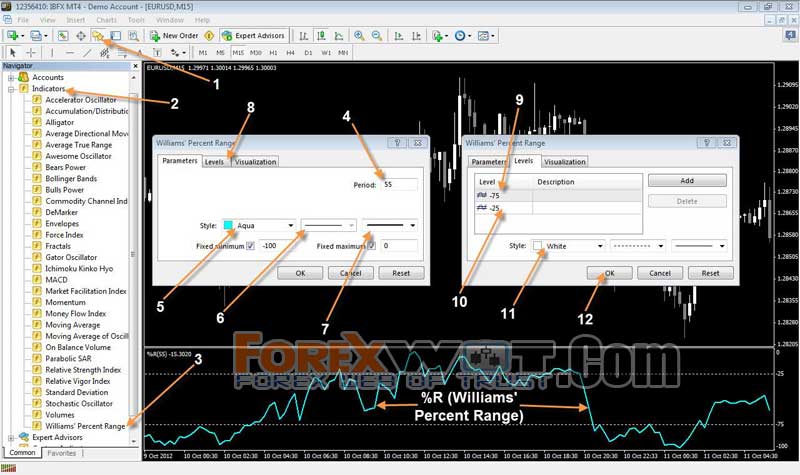
- Click on the Navigator button to open the Navigator widow.
- Click on Indicators to expand the list of indicators.
- Find Williams’ Percent Range (%R) on the list and double click on it. The settings dialogue box will pop up.
- Set the Period at 55.
- Click Style and choose the color for your 55 %R. We are using Aqua in this chart.(5)
- Leave the line type as it is by default.
- This is for setting the 55 %R line width.
- Click on Levels tab. This is where you can set the levels for the 55 %R.
- Change the default levels by double clicking on one of the values. Input the first level, -75.
- Double click the other default value and input the other level we will use, -25.
- Click Style to and choose the color White for your 55 %R levels.
- Click on the OK button to apply the 55 %R on your chart.
4. Stochastic Oscillator – %K period = 5, Slowing = 5, %D period = 5, Price field =Low/High, MA method = Simple, and levels 20 and 80 (default).
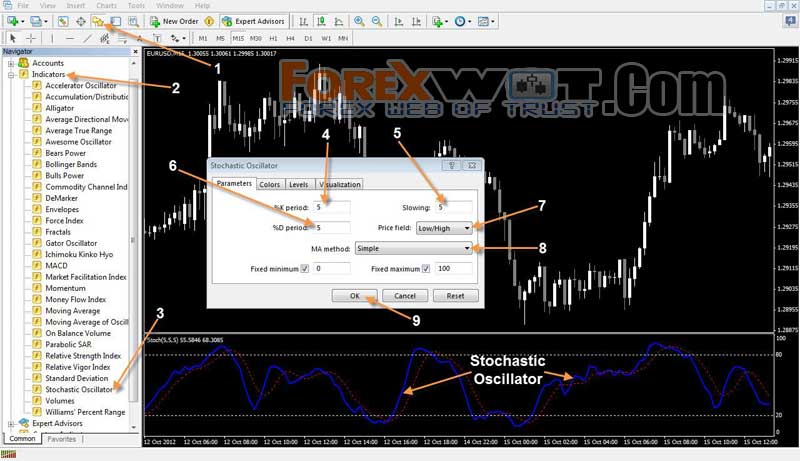
- Click on the Navigator button to open the Navigator widow.
- Click on Indicators to expand the list of indicators.
- Find Stochastic Oscillator on the list and double click on it to open the settings dialogue box.
- Leave %K period at 5 as it is by default.
- Set Slowing to 5.
- Set %D period to 5.
- Leave Price field at Low/High as it is by default.
- Leave MA method at Simple as it is by default.
- Click on OK to apply the Stochastic Oscillator on your chart.
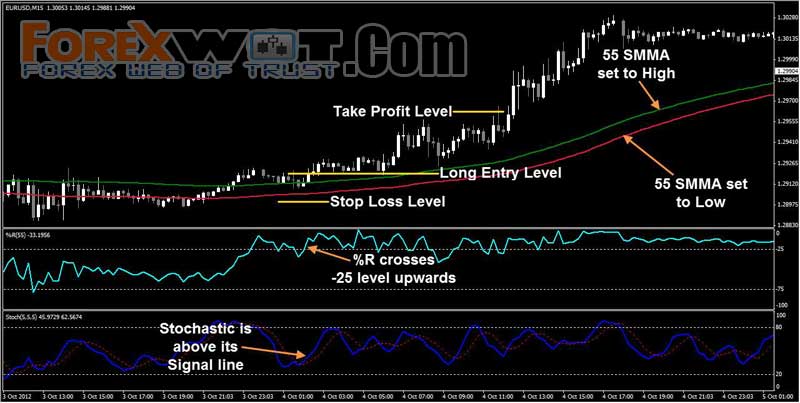
- Price must cross above the 55 SMMA set to High (Green).
- The %R crosses above the -25 level.
- The Stochastic Oscillator is above its Signal line.
- When all the conditions mentioned above are met, we can place our long position.
We have two possible entry types: Aggressive and Conservative.
In the Aggressive entry, we open a buy order without waiting for the signal candle to close.
In the Conservative entry, we wait for the signal candle to close above the 55 SMMA set to High before placing our trade. This serves as a confirmation that we are trading on the right side of the market. - Set the Stop Loss a few pips below the most recent swing low point.
- Set the Take Profit level twice the amount of the stop loss, or close the trade when the price closes below the 55 SMMA set to High.
Let’s have a look at a long trade example on the next page.
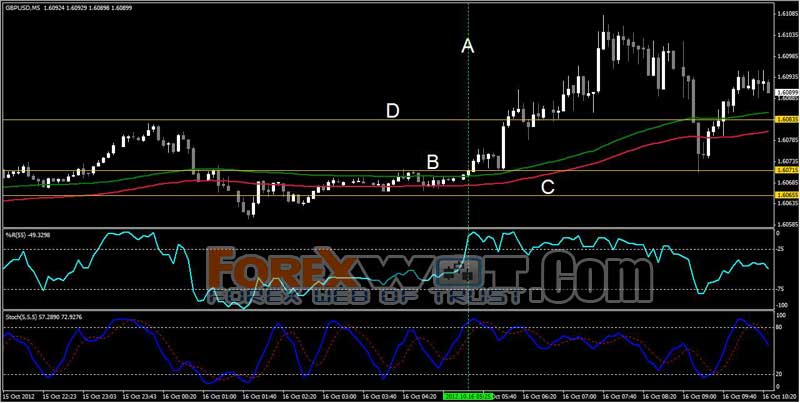
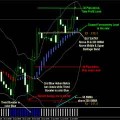
On the image above, we have a GBP/USD 5 minute chart. Along the vertical line (A), all conditions for placing a long trade were met at once – the price crossed above the 55 SMMA set to High, the 55 %R crossed above the -25 level and the Stochastic Oscillator was above its Signal line.
So a buy trade was opened at the close of the signal candle, where all rules were met, along the horizontal line (B) at 1.60715.
Immediately after the buy trade was placed, the Stop Loss was set just below the last swing low (C), for 6 pips at 1.60655.
A Take Profit of 12 pips above the entry was set at 1.60835 (D). As you can see, the Profit Target was hit 35 minutes later.
Now let’s take a look at Short trade conditions.
- Price must cross below the 55 SMMA set to Low (Crimson).
- The %R crosses below the -75 level.
- The Stochastic Oscillator is below its Signal line.
- When all the conditions mentioned above are met, we can open a short position.
For an Aggressive entry, we don’t need to wait for the current candle to close before entering the trade.
For a Conservative entry, wait for the candle to close below the 55 SMMA set to Low before placing the trade. - Set the Stop Loss a few pips above the most recent swing high point.
- Set the Take Profit twice the amount of the Stop Loss, or close the trade when the price closes above the 55 SMMA set to Low.
Now let’s see a short trade example.

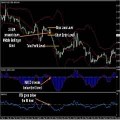
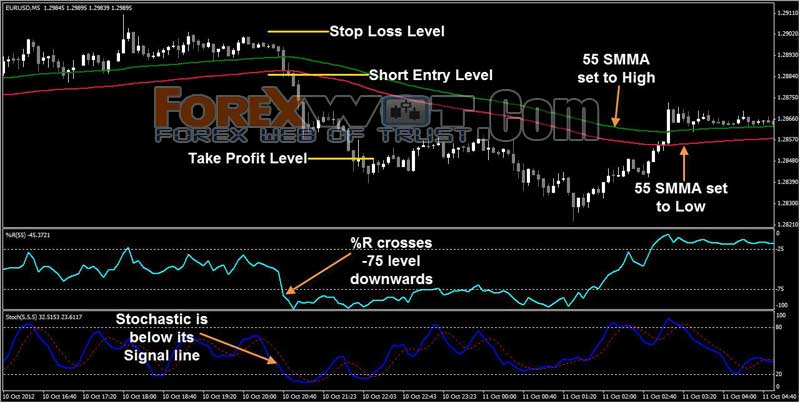
Here’s a sell trade example on the EUR/USD 5 minute chart.
Along the vertical line (A), all the rules for a sell trade were met simultaneously. The price has crossed below the 55 SMMA set to Low, the 55 %R crossed below the -75 level and the Stochastic Oscillator was below its Signal line.
Immediately after the signals above appeared, a short trade was opened at 1.29760 (B). Then a Stop Loss of 12 pips was set just above the nearest swing high point at 1.29920 (C).
Last but not least, the Take Profit of 32 pips was set at 1.29440 (D), which was achieved 40 minutes later.
That’s all there is to it for the Golden Strategy, a simple yet effective technique. This system can help you spot some of the best entries possible. Moreover, it gives you the advantage of trading with any timeframe that you want.
I look forward to this helping you to become a better trader.


