Easy simple Forex TRIX Retracement Trading Strategy with 200SMA and 20EMA Trend Filter – The 200-day simple moving average (SMA) is considered a key indicator by traders and market analysts for determining the overall long-term market trend.

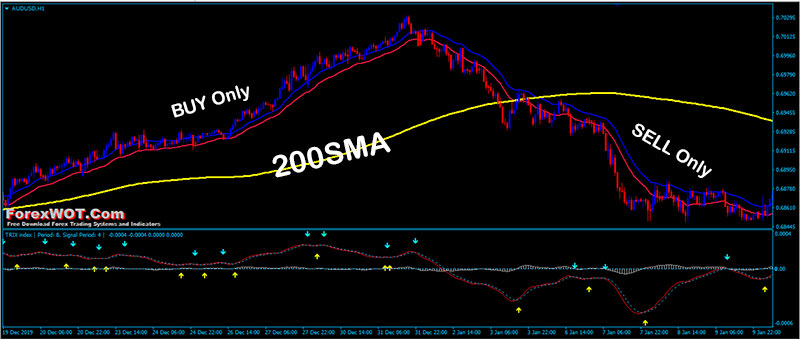
As a very long-term moving average, the 200-day SMA is often used in conjunction with other, shorter-term moving averages to show not only the market trend but also to assess the strength of the trend as indicated by the separation between moving average lines.
When moving average lines converge, this indicates a lack of definitive market momentum, whereas increasing separation between shorter-term moving averages (20EMA) and longer-term moving averages, such as the 200-day SMA, indicates increasing trend strength and market momentum.
- Time Frame : 30 min or higher
- Currency pairs : any.
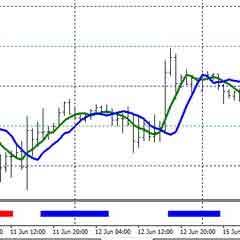
- 20 EMA Low (Red line)
- 20 EMA high (Blue line)
- 200 SMA close
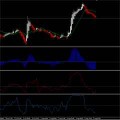
- TRIX-Indicator.
The TRIX indicator is a versatile technical analysis tool that combines trend and momentum into one indicator.
It is comprised of the rate of change of a triple exponentially smoothed moving average. The key signals generated by TRIX are divergences and signal line crossovers. Shorter timeframes are more sensitive, while longer time frames reduce sensitivity.
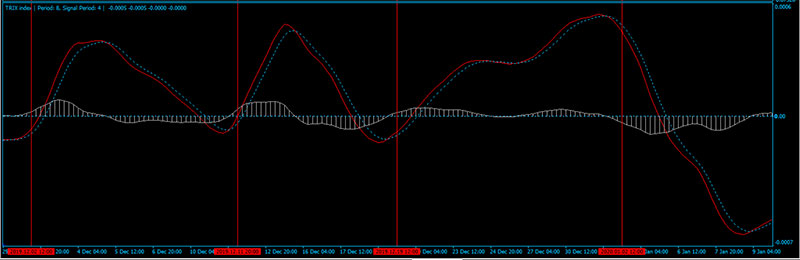
TRIX can typically be interpreted that when the value is positive, momentum is up and when the value is negative, momentum is down.
Something to keep in mind however, is that as with any indicator comprised of moving averages, there is lag inherently built into the indicator.
It may also be noticed that TRIX is very similar to another technical analysis tool, the MACD, however the TRIX has a line that is much smoother.
There are two different type of crossovers when analyzing the TRIX. There are Zero Line crossovers as well as signal line crossovers.
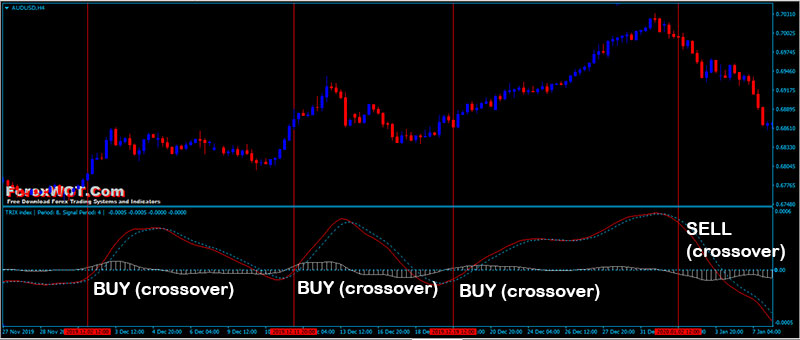
Zero Line crossovers typically have a lot of lag and are not always reliable. Signal line crossovers on the other hand, can signify an underlying change in momentum.
- When the TRIX line is negative yet crosses above the signal line, upside momentum is increasing.
- When the TRIX line is positive yet crosses below the signal line, downside momentum is increasing.
The rule for this Trading system are very simples are based on the price action. Trade only in trend.
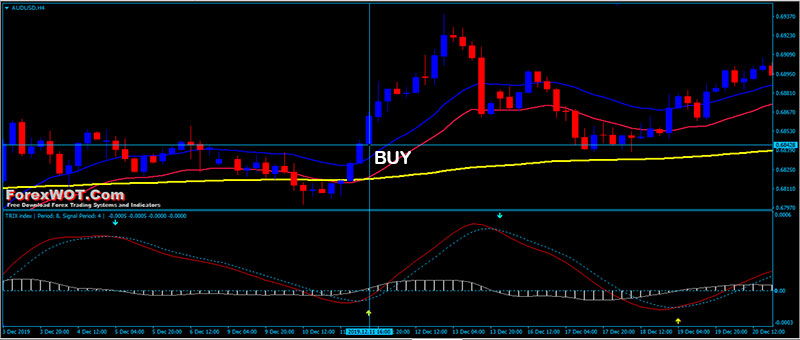
- 20EMA channel above 200SMA line
- TRIX-Indicator positive crosses (yellow arrow signal)
- The previous candle was closed above 20EMA channel
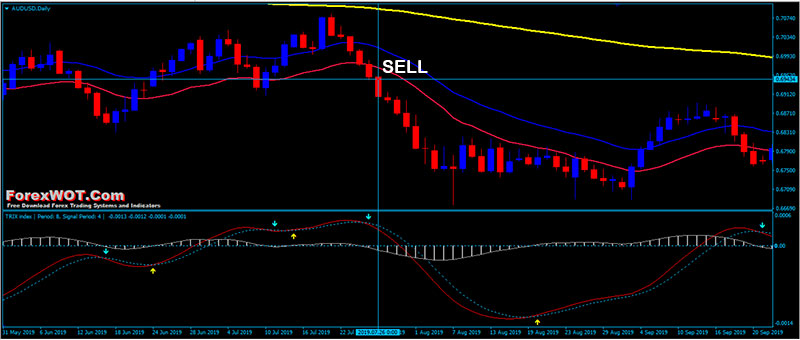
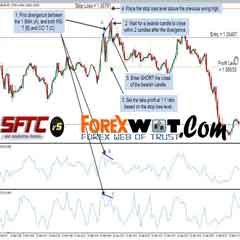
- 20EMA channel below 200SMA line
- TRIX-Indicator negative crosses (aqua arrow signal)
- The previous candle was closed below 20EMA channel
- Profit Target predetermined, depends by time frame and currency, or ratio 1:2 (or higher) top loss.
- Initial Stop loss on the previous swing after X pips in gain move stop loss at entry point.
[sociallocker]
[/sociallocker]
 Foreign Exchange Trading : Online Forex Master Level Trading System and Strategy
 MA COBRA Forex & Stocks Trading Strategy (Extremely Low Risk High Reward Trading Strategy) (COBRA SYSTEM)
 Stocks and Currency Trading With GUPPY Multiple Moving Averages Trading System
 2 MACD Effortless Forex & Stocks Swing Trading Strategy
 FREE DOWNLOAD 20+ Best Forex MACD-Moving Average Trading System
 Forex Trading Short Course – How to Trade Forex with COG Trading Indicators and Strategy
 Forex Forbi EMA-Bollinger Moderate Swing and Trend Trading Strategy
 Forex Currency Trading Course : How to Trade Forex Successfully with U-TURN Cross Over Trading System
 RSI Momentum Secret Method Forex Trading System – Step by Step Tutorial
 5 Minute Chart Surefire RSI-CCI Forex Trading System and Strategy
