DOWNLOAD FX Sniper’s MA Trading Strategy with Blip Bloop “Market Trend” indicator. This trading system is very easy to use to identify the market trends and determine their relative strength.
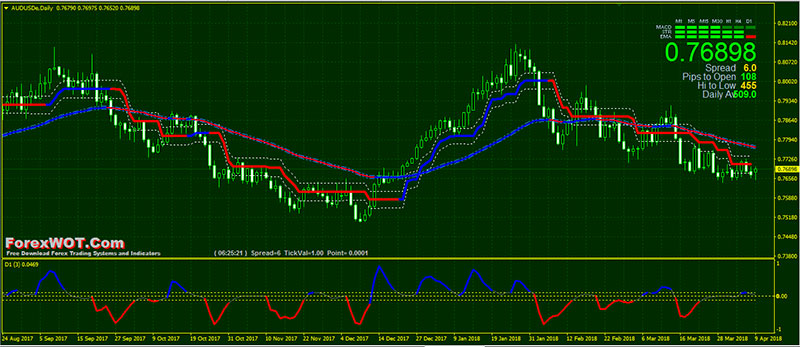
Being able to identify trends is one of the most fundamental skills a forex trader should acquire.
The main method of identifying trends is by using the combination of FX Sniper’s MA and Blip Bloop “Market Trend” indicator.
FX Sniper’s MA and Blip Bloop are LAGGING indicators, which means that they do not predict new trends but confirm trends once they have been established.
In general, the market is deemed to be in an uptrend when the price is above the indicators and the average is sloping upward.
Conversely, a trader will use a price below a downward sloping average to confirm a downtrend.
Many traders will only consider holding a long position in an asset when the price is trading above the FX Sniper’s MA and Blip Bloop “Market Trend” indicator.
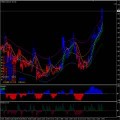
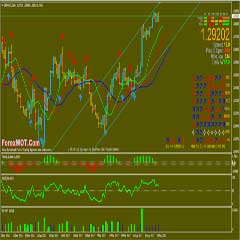
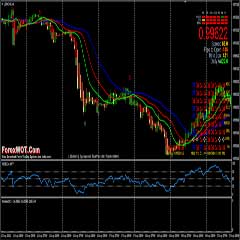
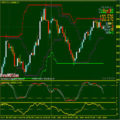
Take a look at the image below.
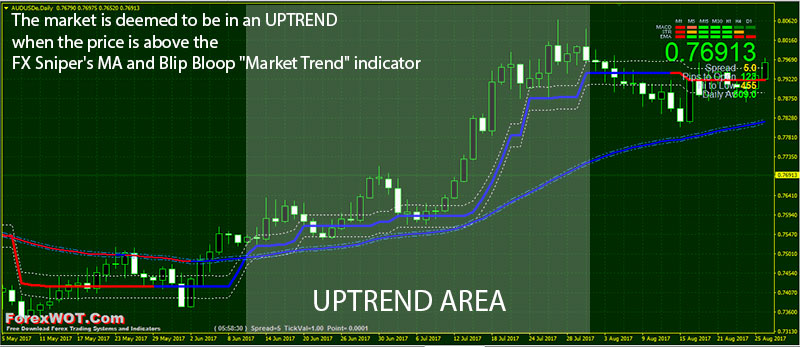
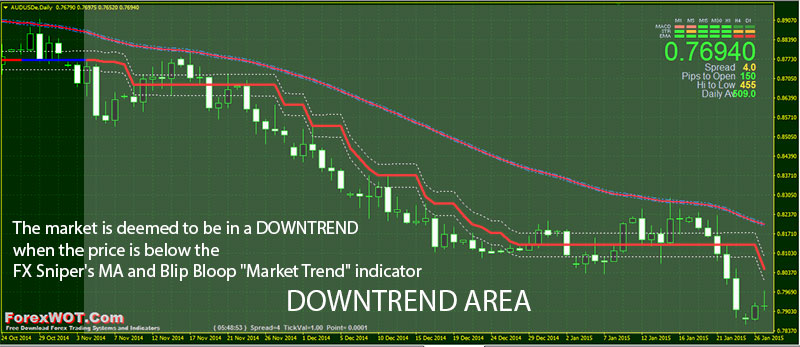
The combination of FX Sniper’s MA and Blip Bloop “Market Trend” indicator is a good way to gauge the direction of a trend.
The basic premise of this filter is that if the short-term trend (Blip Bloop indicator) and the long-term trend (FX Sniper’s MA) are all aligned in one direction, then the trend is strong.
This is the best technical trading strategy for day trading and short-term swing trading.
This system is designed to make trading easier for the average person and professional trader.
- Best Time Frames: H1, H4, and Daily
- Recommended Currency Pair: GBPUSD, EURUD, USDCAD, USDJPY
- FX Sniper’s MA
- Blip Bloop
- Signal Trend
- Moving Average
- TDI Smoothed
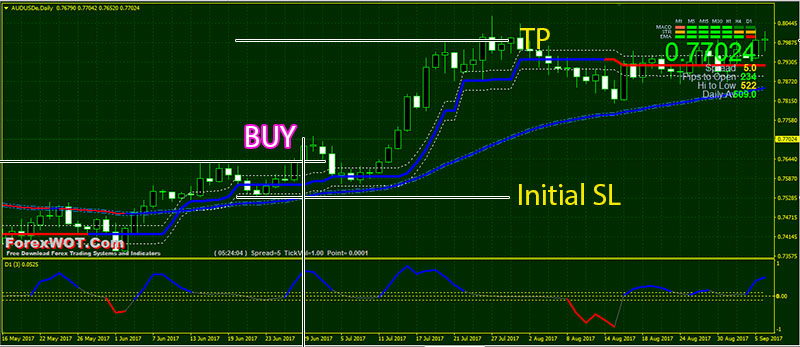
- FX Sniper’s MA blue color
- Blip Bloop blue color
- The Blip Bloop indicator above the FX Sniper’s MA
- TDI Smoothed blue color
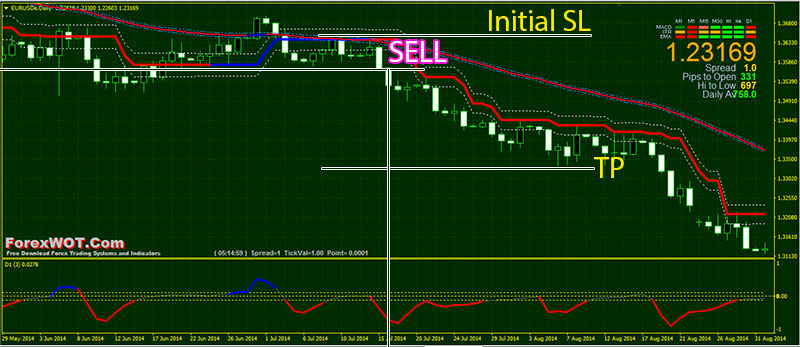
- FX Sniper’s MA red color
- Blip Bloop red color
- The Blip Bloop indicator below the FX Sniper’s MA
- TDI Smoothed red color
The first thing to understand about trend identification is that it is not A PERFECT SCIENCE.
If you ask different traders, you will hear different versions of what the current trend of a market is.
Some will give you the short-term trend, some the long-term and some the mid-term.
However, the most important trend to identify is the most obvious current dominant daily chart trend. We can identify that using the combination of FX Sniper’s MA and Blip Bloop “Market Trend” indicator.
I like to ask myself, what is the chart looking like over the last year or two, 6 months and 3 months? That shows me the long-term, mid-term and short-term views, respectively.
Doing this gives me a very clear idea of the overall chart direction.
If all else fails, zoom out on a daily or weekly chart and take a step back and just ask yourself, “Is this chart falling or rising?”.
Don’t over complicate it!




thanks