Moving Average of Oscillator (OsMA) An abbreviation for Oscillator – Moving Average. OsMA is used in technical analysis to represent the variance between an oscillator from its moving average, over a given period of time.
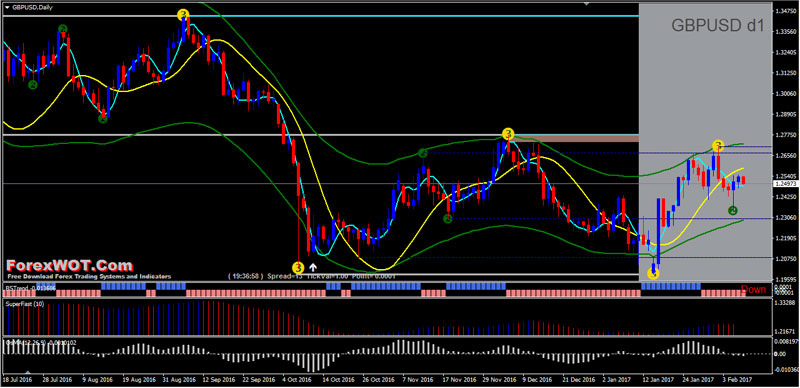
Typically the primary line of the MACD will serve as the oscillator, with the signal line of the MACD then acting as the moving average. The OsMA relationship is one of the most fundamental in technical analysis.
BREAKING DOWN ‘OsMA’
The oscillator is a useful indicator of trend and relationship between data, which can signal when a security may be overbought or oversold, due to results of price and/or volume oscillators.
The MACD is the most commonly used indicator for determining this relationship in technical analysis, however, many other indicators have been developed for similar purposes, making use of different oscillators and moving average calculations.
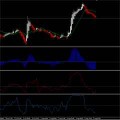
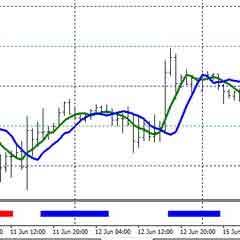
Moving Average of Oscillator (OsMA) Support Resistance Trading System
Most Successful Forex Trading Strategy – “ForexWOT.Com-OsMASupportResistance” is a template for forex that have as purpose,I’ interpretation of the movements of the currencies with static levels in the space: Support and Resistance.
The tool Metatrader 4 that i use for determine SUPPORT and RESISTANCE areas is the Superdem 4z indicator (they are also the other similar tools on MT4 ).
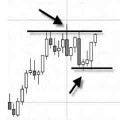
The support/resistance of an identified level, whether discovered with a trendline or through any other method, is deemed to be stronger the more times that the price has historically been unable to move beyond it.
Many technical traders will use their identified support and resistance levels to choose strategic entry/exit prices because these areas often represent the prices that are the most influential to an asset’s direction.
Most traders are confident at these levels in the underlying value of the asset so the volume generally increases more than usual, making it much more difficult for traders to continue driving the price higher or lower.
- Best Time Frame : 15 min or higher.
- Currency pairs : any.
BUY Rules
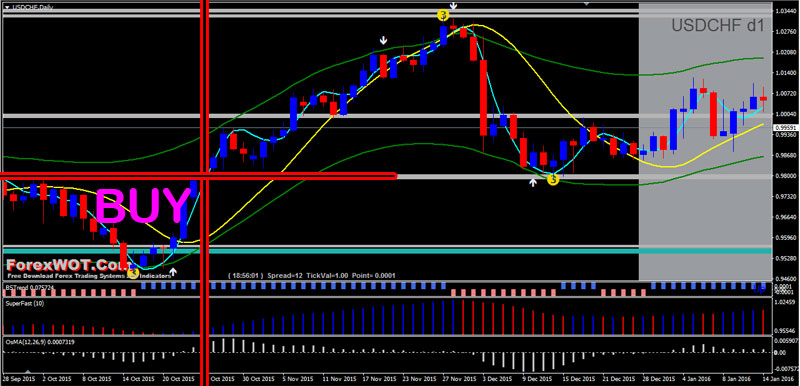
- Wait until an area of support is formed
- Make sure that this support area is tested by the action of the price
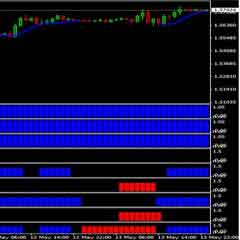
- BSTrend blue bar
- SuperFast (10) indicator blue
- OsMA histogram above 0 level
- Hull crosses upward the TM555 and and inverse fisher blue line
SELL Rules
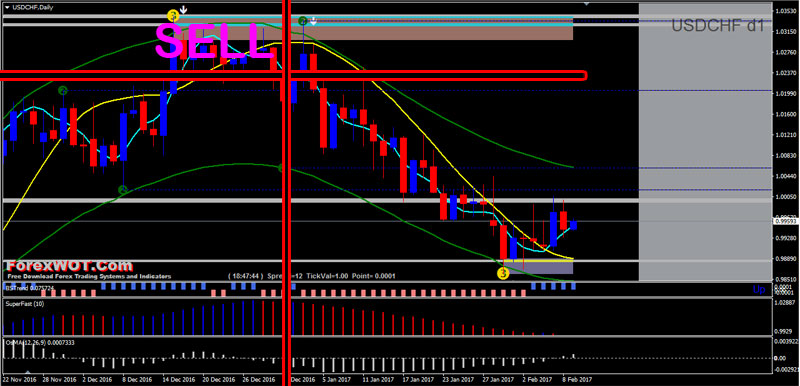
- Wait until an area of resistance is formed
- Make sure that this resistance area is tested by the action of the price
- BSTrend red bar
- SuperFast (10) indicator red
- OsMA histogram below 0 level
- Hull crosses downward the TM555 and inverse fisher red line
EXIT Position
- Profit target ratio 1.3
- Stop loss below/above S/R area
NOTE : Trader Attitude
Attitude in trading means ensuring that you develop your mindset to reflect the following four attributes:
- Patience
Once you know what to expect from your system, have the patience to wait for the price to reach the levels that your system indicates for either the point of entry or exit.
If your system indicates an entry at a certain level but the market never reaches it, then move on to the next opportunity.
There will always be another trade. In other words, don’t chase the bus after it has left the terminal; wait for the next bus.
- Discipline
Discipline is the ability to be patient – to sit on your hands until your system triggers an action point. Sometimes, the price action won’t reach your anticipated price point.
At this time, you must have the discipline to believe in your system and not to second-guess it. Discipline is also the ability to pull the trigger when your system indicates to do so. This is especially true for stop losses.
- Objectivity
Objectivity or “emotional detachment” also depends on the reliability of your system or methodology.
If you have a system that provides entry and exit levels that you know have a high reliability factor, then you don’t need to become emotional or allow yourself to be influenced by the opinion of pundits who are watching their levels and not yours.
Your system should be reliable enough so that you can be confident in acting on its signals.
- Realistic Expectations
Even though the market can sometimes make a much bigger move than you anticipate, being realistic means that you cannot expect to invest $250 in your trading account and expect to make $1,000 each trade.
Although neither a short-term nor longer term time frame is necessarily safer than the other, the short-term time frame may involve smaller risks if the trader exercises discipline in picking trades. It’s a question of risk versus reward.


