High Accuracy trading System with The Most Powerful Trade Filter that Reduces Risk and Improves Your Strategy (Joker Filter, SMA, BBands Stop, Bullish Bearish, and Deep Bar Indicator). The best tools to improve the quality of your entry or exit.
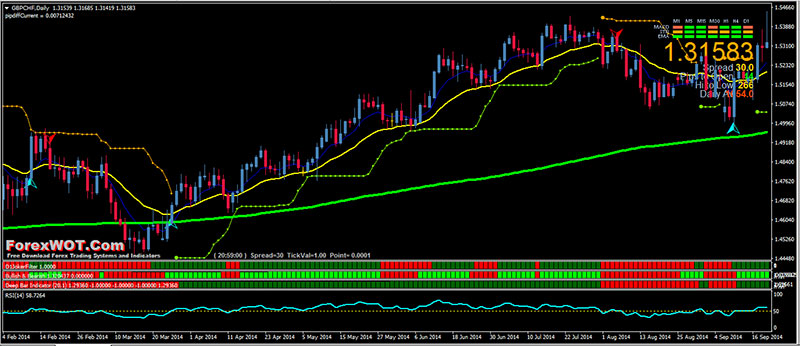
The problem I’ve seen, however, is many traders attempt to use tools without fully knowing what the tools’ strengths and weaknesses are; oftentimes grouping similar indicators together or missing out on an important subset of tools that might be worth considering.
So today I break down 3 easy and super simple tools known as “filters” that can be used on various types of strategies.
Hopefully, this article will give you ideas on ways to improve your own strategy, whether you are trading trends, ranges, or something entirely different.
We’ve all heard the saying, “the trend is your friend” or “trade the path of least resistance.”
These phrases are used by traders that want to trade in the same direction as the overall trend.
- But what if we have a difficult time locating the trend….?
- What do we do if we are uncertain about our direction bias….?
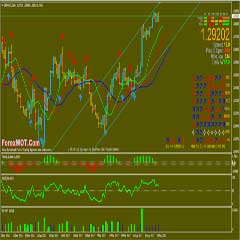
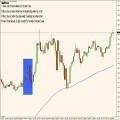
An excellent tool to add to a trend-based strategy is the 200-period Simple Moving Average. By averaging the closing price over the last 200 bars, we can see if the current price action is above or below the average.
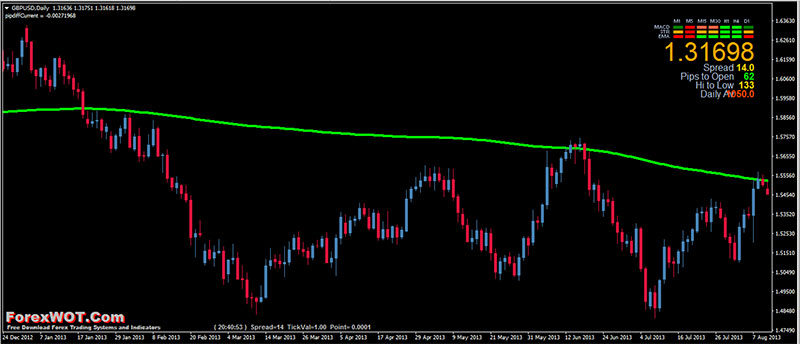
- Anytime we see price ABOVE the 200-period Moving Average line, we should look for BUYING opportunities.
- Anytime we see price BELOW the Moving Average line, we should look for SELLING opportunities.
This ensures we are trading in the same direction as the prevailing trend.
We can also take note of the strength of an existing trend by how far price has moved away from the 200-period MA.
The further the price is away from the average, the stronger the trend.
This can be seen in the chart above.
With the current drop in Forex volatility, many traders have migrated over to using range-bound strategies.
A range strategy attempts to BUY low and SELL high when the price is moving primarily sideways.
The only problem is that sometimes market dynamics can change, turning RANGING pairs into pairs that may begin TRENDING.
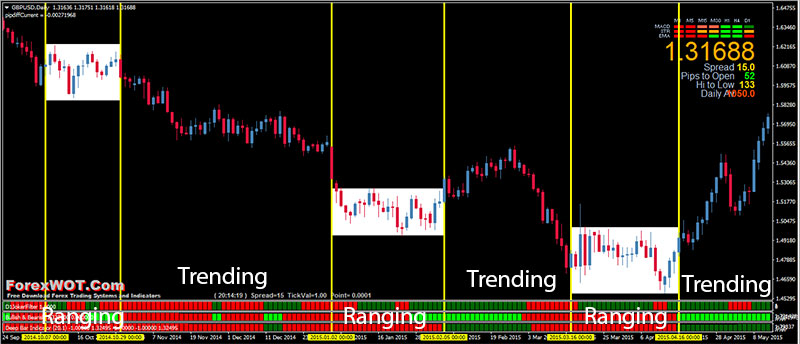
To mitigate range trading during these transition times, we can use 3 technical indicators called Joker Filter, Bullish Bearish, and Deep Bar Indicator.
We use the collaboration of these 3 indicators as a filter that tells us if a currency pair is currently in a trend our not.
- When Joker Filter, Bullish Bearish, and Deep Bar Indicator are in the same color (green or red), the market is TRENDING.
- When Joker Filter, Bullish Bearish, and Deep Bar Indicator are NOT in the same color, the market is RANGING.
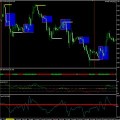
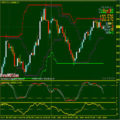
The chart above shows a period of time where the price was trending and later changed to ranging.
The final filter on my list is the BBand Stop indicator.
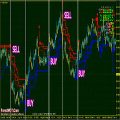
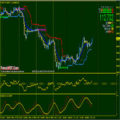
The BBands Stop indicator (Bollinger Bands Stop line) is a trend indicator. When the price is over the green curve, the trend is BULLISH or BEARISH if the price is below its orange line.
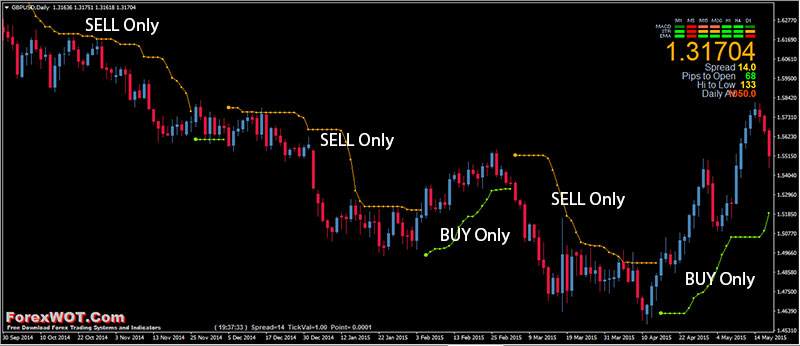
It’s built with Bollinger bands phases and act pretty much like a Supertrend, the BBands stop line can also be used to determiner stop loss when you jump in a trend given by its signals (drawn with big “bullets” on chart).
Bollinger bands period and deviation can be changed in settings. The “MoneyRisk” setting is a parameter to widen the spread between the bands and the current price.
- Best Time Frames: H1, 4H, and Daily
- Recommended Currency Pairs: Bitcoin, GBPUSD, EURUSD, GBPJPY, and USDJPY
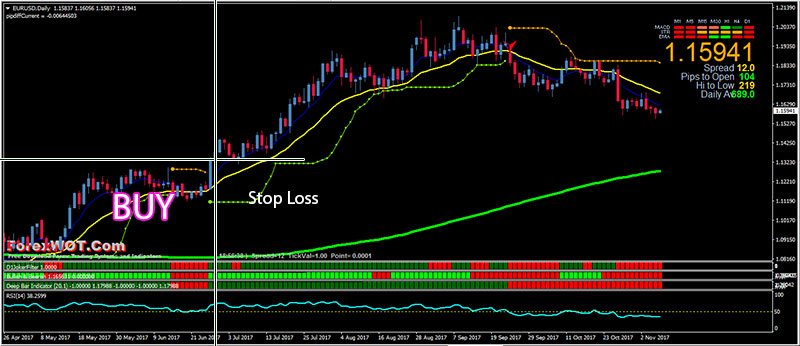
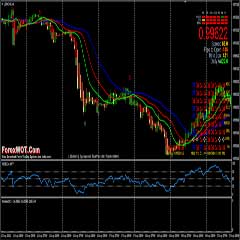
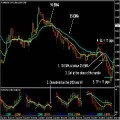
- Price ABOVE the 200-period Moving Average line. (in this case, we should look for BUYING opportunities)
- The Joker Filter, Bullish Bearish, and Deep Bar Indicators are in the same GREEN color. (the market is TRENDING UP).
- The price is above the green BBands Stop
- RSI line upward and above 50 level
- GOLD 999 indicator BULLISH (Blue line 8 EMA upward and above Yellow line 21 EMA)
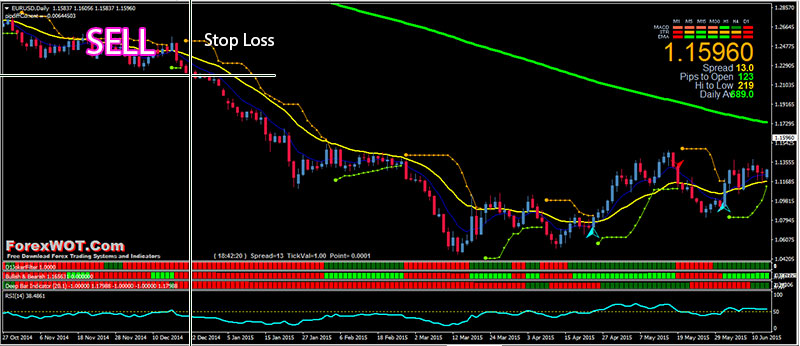
- Price BELOW the 200-period Moving Average line. (in this case, we should look for SELLING opportunities)
- The Joker Filter, Bullish Bearish, and Deep Bar Indicators are in the same YELLOW color. (the market is TRENDING DOWN).
- The price is below the yellow BBands Stop
- RSI line downward and below 50 level
- GOLD 999 indicator BEARISH (Blue line 8 EMA downward and below Yellow line 21 EMA)
This is a very simple but Powerful Trading system.
But however, the trading system that works best is the one that you have personally developed upon years of learning that best suits your PSYCHOLOGY and PERSONAL TRADING STYLE.
Hopefully, this article has given you ideas on ways to improve your own strategy, whether you are trading trends, ranges, or something entirely different.


