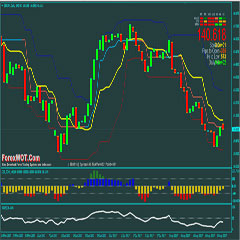
Forex High Accuracy USDJPY, GBPJPY, and EURJPY H4 time frame trading with Donchian Channel Breakout System. This is a very simple trading system but highly effective to trade USDJPY, GBPJPY, and EURJPY pairs.
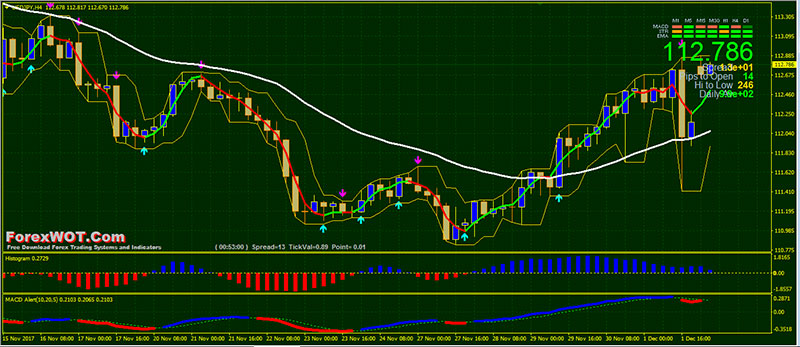
Yes, you’re right… Traders use Donchian Channels to understand the support and resistance levels.
The Donchian channel measures the high and the low of a previously defined range – typically of the past 3, 5, 10, and 20 days.
Typically, a trader would look for a well-defined range and then wait for the price to break out to either one side for a trade entry trigger.
But, there is more to the Donchian channels and we will discuss how to increase the quality of the signals.
Donchian Channels were invented by trader Richard Donchian, one of the pioneers of technical analysis.
The Donchian channel plots two lines on a chart:
- one line is the highest high over a set period;
- the other line is the lowest low over a set period.
The Donchian channel indicator is a simple but effective indicator that plots the highest high and the lowest low over a set period of time.
It is useful for identifying price breakouts and is used in some trend-following systems.
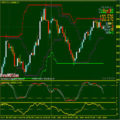
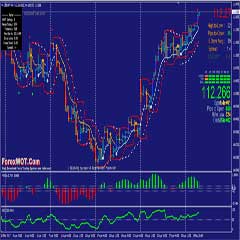
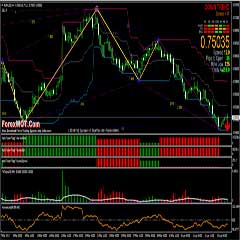
Now, let’s take a look at the below images to illustrate Donchian Channels.
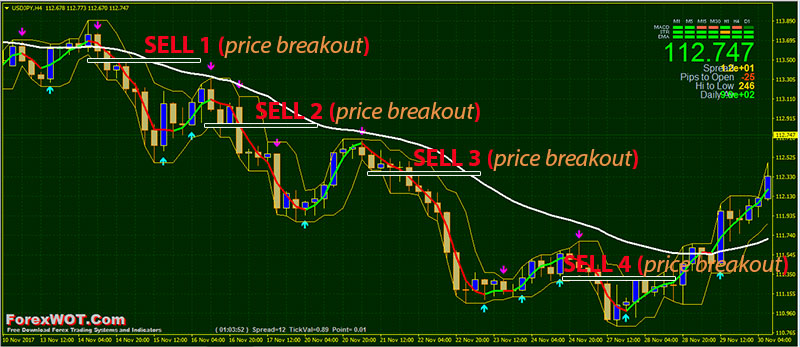
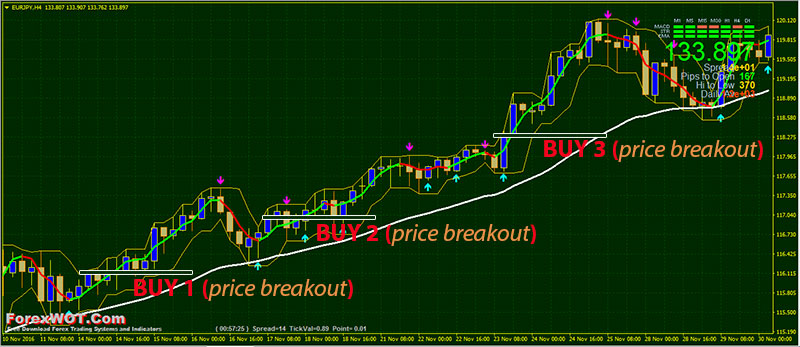
Donchian channels are mainly used to identify the breakout of a stock, currency pair, or any traded entity enabling traders to take either long or short position.
Traders can take a long position, if the stock is trading higher than the Donchian channels “n” period and book their profits/short the stock if it is trading below the DC channels “n” period.
Combining Donchian Channel trading strategies with other trading strategies might decrease the false entry/exit signals and give a clearer picture of trading opportunities.
Donchian Channel + EMA + Histogram + MACD
Let’s combine the Donchian Channel trading strategies with the EMA, Histogram, and MACD.
Here let’s try to match the moments when the price interacts with important Donchian Channel entry points in conjunction with EMA trend, Histogram and MACD crosses.
When we discover the correlation between Donchian Channel and 3 filters above, we would be able to filter the false entry signals and attain a better success rate for our trade opportunities.
- Best Time Frames: H4
- Most Recommended Currency Pairs: USDJPY, GBPJPY, and EURJPY
- Donchian
- Exponential Moving Average
- Histogram
- MACD
- Signal Trend
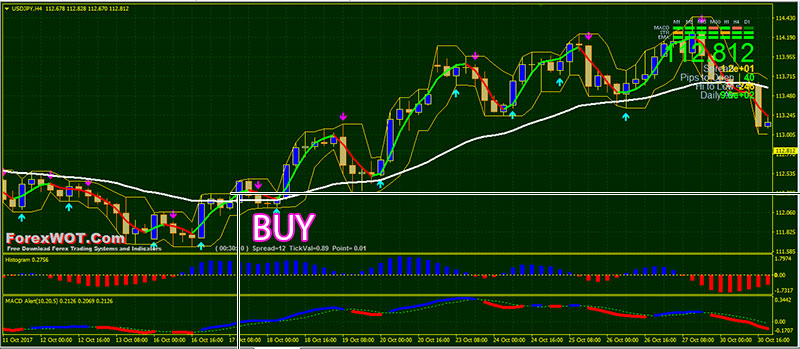
- Price upward higher than the “upper band” of Donchian channels
- Price above 34 EMA
- NonLagMA Aqua line
- Histogram blue color
- MACD blue color
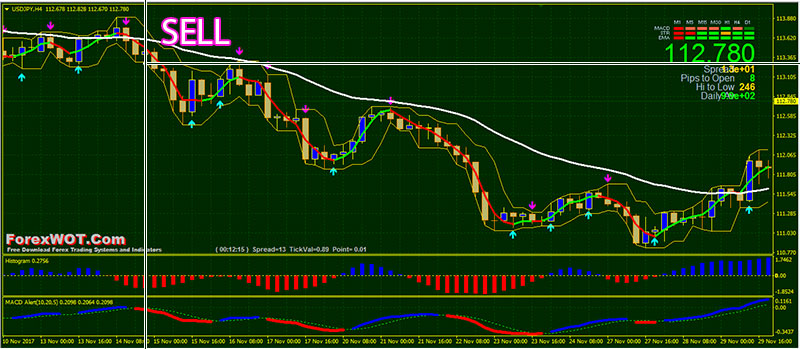
- Price downward lower than the “lower band” of Donchian channels
- Price below 34 EMA
- NonLagMA red line
- Histogram red color
- MACD red color
We now know that the Donchian Channel is a SIMPLE but EFFECTIVE indicator that plots the highest high and the lowest low over a set period of time.
It is useful for identifying price breakouts and is used in some trend-following systems. Below are what you should know about Donchian Channels.
- Donchian Channels indicate the support/ resistance levels of a security
- Donchian Channels upper band is used for identifying long/buy positions
- Donchian Channels lower band is used for identifying short/sell positions
- Donchian Channels can be used as a breakout indicators by traders
- Donchian Channels usage along with other indicators can reduce the number of false trading signals
A few simple trading strategies using the Donchian Channels are:- Donchian Channel + MACD
- Donchian Channel + Volume Oscillator
- Donchian Channel + Stochastic Oscillator+ Moving Average
The Donchian channels can be used in many different ways, so feel free to experiment with a risk and cost-free demo account before opening a high-risk, high-reward live account.


