High Accuracy Guppy Trend Line System – A very simple technique to improve your Trend Line Breakouts trading strategy. If used correctly, this system can more accurate than any other method.
TREND LINES are probably the most common form of technical analysis in forex trading.
They are probably one of the most underutilized ones as well. And if drawn correctly, they can more accurate than any other method.
Unfortunately, most forex traders don’t draw them correctly or try to make the line fit the market instead of the other way around.

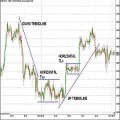
In their most basic form, an UPTREND line is drawn along the bottom of easily identifiable support areas (valleys).
In a DOWNTREND, the trend line is drawn along the top of easily identifiable resistance areas (peaks).
Trend Lines are an important tool in technical analysis for both trend identification and confirmation.
To draw forex trend lines properly, all you have to do is locate two major tops or bottoms and connect them.
Or…
A trend line is a straight line that connects two or more price points and then extends into the future to act as a line of support or resistance.
Many of the principles applicable to support and resistance levels can be applied to trend lines as well.
An uptrend line has a positive slope and is formed by connecting two or more low points (support pints).
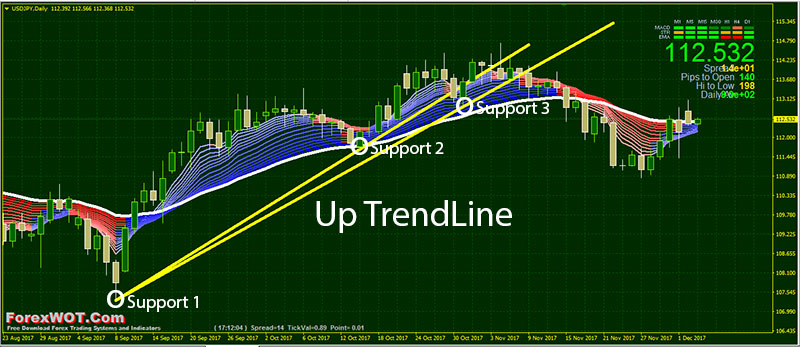
The second low must be higher than the first for the line to have a positive slope.
Uptrend lines act as SUPPORT and indicate that net-demand (demand less supply) is increasing even as the price rises.
A rising price combined with increasing demand is very bullish and shows a strong determination on the part of the buyers.
As long as prices remain above the trend line, the uptrend is considered solid and intact.
A break below the uptrend line indicates that net-demand has weakened and a change in trend could be.
A downtrend line has a negative slope and is formed by connecting two or more high points.
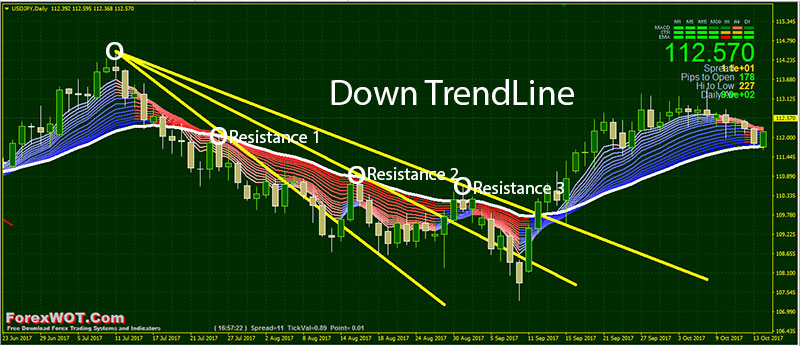
The second high must be lower than the first for the line to have a negative slope.
Downtrend lines act as RESISTANCE and indicate that net-supply (supply less demand) is increasing even as the price declines.
A declining price combined with increasing supply is very bearish and shows the strong resolve of the sellers.
As long as prices remain below the downtrend line, the downtrend is solid and intact.
A break above the downtrend line indicates that net-supply is decreasing and that a change of trend could be imminent.
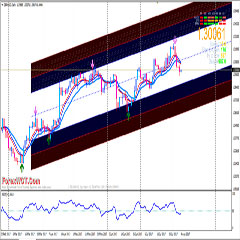
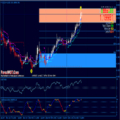
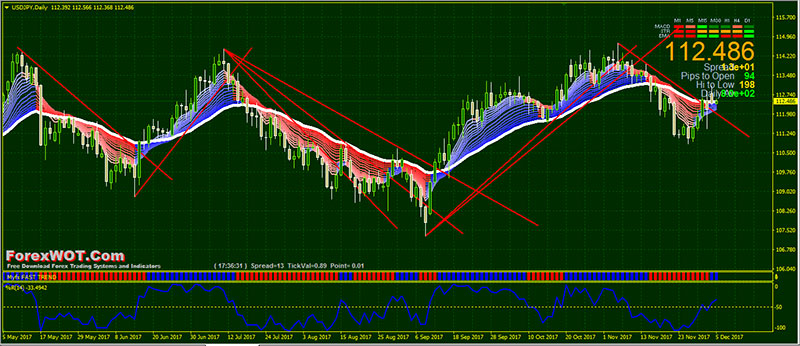
This “ForexWOT Guppy Trend Line Trading System” is a very effective system if you understand how to use correctly.
The combination of the MANUAL trend line and Guppy System is a great method to identify the trend and spotting situations where price is making a reversal and continuation.
- Best Time Frames: H1, H4, and Daily
- Most Recommended Currency Pairs: EURUSD, GBPUSD, USDJPY, EURJPY, GBPJPY, and BITCOIN
- Guppy Trader
- Signal Trend
- Fast Trend
- Williams’ Percent Range
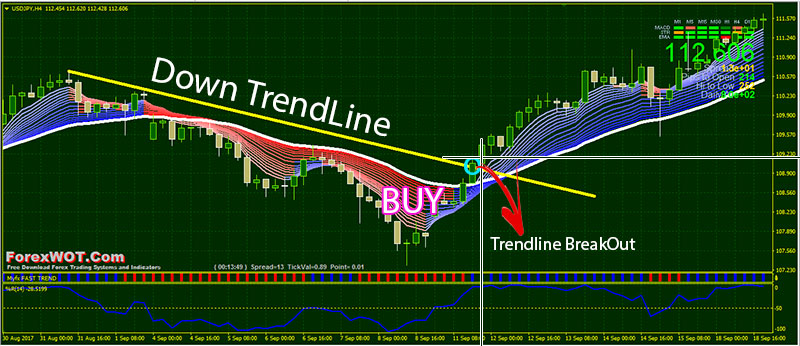
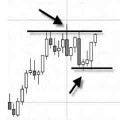
- We have a breakout from the Down TrendLine (Trendline BreakOut).
- Guppy Trader blue color
- Fast Trend blue color bars
- Wiliams’ Percent Range upward above -50 level
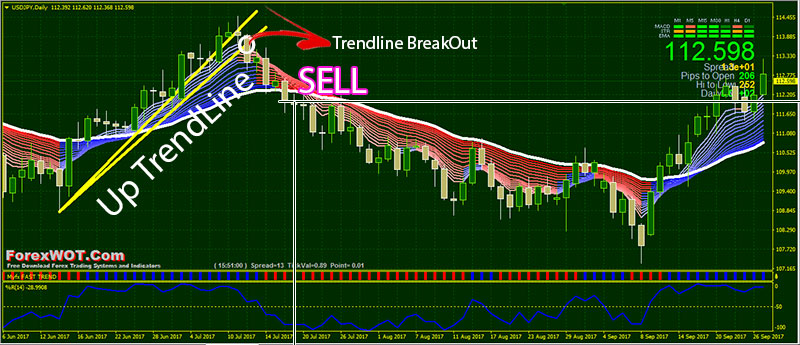
- We have a breakout from the Rising TrendLine (Trendline BreakOut).
- Guppy Trader red color
- Fast Trend red color bars
- Wiliams’ Percent Range upward below -50 level
If you are looking a simple trading set up, that is objective and can give you higher profits than the amount you risk, the “ForexWOT Guppy Trend Line Trading System” is a good start.
Yes… It’s a powerful trading system but you need to add the trendline MANUALLY.


