Forex Price & Trend Channels Trading with ForexWOT HA Donchian Channel System – One of the most important technique that technical traders need to master, is spotting market trends.
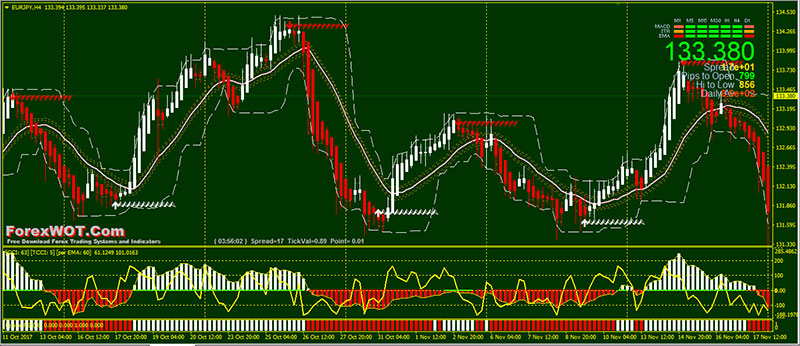
There are a number of indicators designed to do this, including Heiken Ashi.
Two benefits of the Heiken-Ashi are the direction of the trend and trend strength.
The first benefit of Heiken-Ashi is showing you the direction of the trend through color-coded candles. The white candle is showing you the trend is up. The red candle will show you the trend is down.
The second benefit of Heiken-Ashi is that it also indicates the strength of a trend. You will notice that many of the candles do not show a wick in the opposite direction of the trend.
This lack a wick is a result of the calculation above to indicate the average price moving in the direction of the trend. So when you see no wick, that means you’re in a strong trend.
When you’re in a trade and you’re unsure of whether or not to exit, consider the Heiken-Ashi candle wick. If the Heiken-Ashi continues to show the trend moving in your favor that is strong then you can confidently stay in your trade.

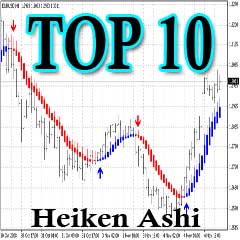
For example, take a look at the image above…
You’ll notice a trader using standard Japanese candlestick (left side) may get confused during congestion and possibly exit the trend.
With the Heiken-Ashi (right side), by virtue of the blue candle and no wick to the downside, they can confidently stay in their buy trade. This allows them to stay on a strong trend longer.
The Donchian channel indicator consists of an envelope with upper and lower bands and a middle band.
The Donchian channels’ high and low bands are a great way to identify support and resistance levels.

The indicator plots a 20-period default high and low price band with the middle band showing the average of the two. But in this ForexWOT Heiken Ashi Donchian Channel System, 10 days is my FAVORITE and the BEST SETTING.
- Best Time Frames: H1, H4, and Daily
- Most Recommended Currency Pairs: GBPUSD, EURUSD, USDJPY, GBPJPY, and EURJPY
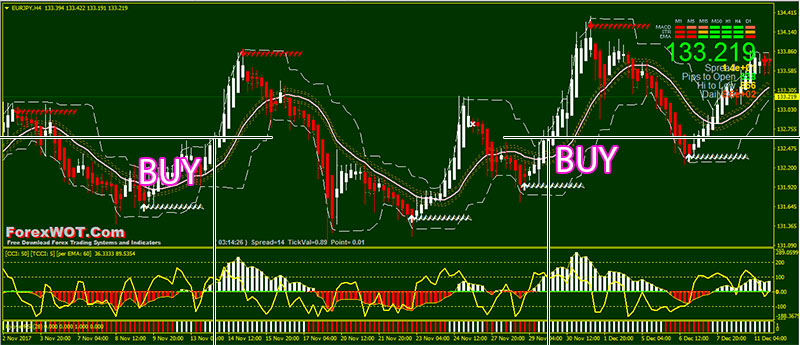
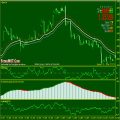
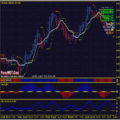
- The white color Heikin-Ashi candles have big bodies and long upper shadows but no lower shadow (The market is Bullish)
- The price rises above the Donchian Channel 10-days high
- White color AffZZx2 arrow below the previous swing low
- CCI Woodies white color histogram
- PJ-Over RSI indicator white color bars
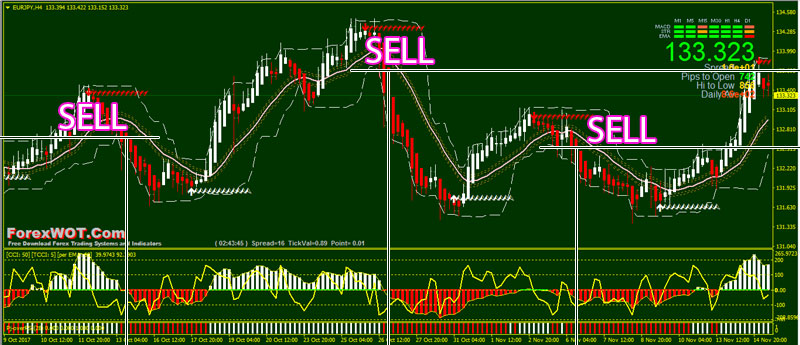
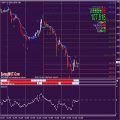
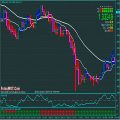
- The red color Heikin-Ashi candles have big bodies and long lower shadows but no upper shadow (The market is Bearish)
- The price falls below the Donchian Channel 10-days low
- Red color AffZZx2 arrow above the previous swing high
- CCI Woodies red color histogram
- PJ-Over RSI indicator red color bars
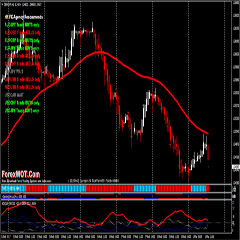
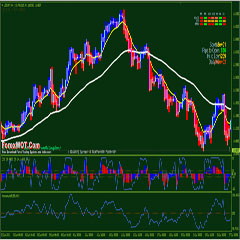
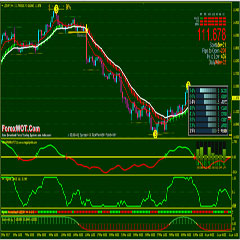
The major components of this system are Heiken Ashi candles and Donchian Channel.
The Donchian channel indicator is a relatively simple technical indicator that only plots visually the 10-period high and low prices.
Based on the breakout from the high or low levels, traders can devise various trend-following or break out based trading strategies.
The general idea behind the Heikin Ashi bars is that they smooth the price action. As a result, much of the noise shown in traditional Japanese Candlesticks is eliminated with Heikin Ashi charting.


