DOWNLOAD Forex Heiken Ashi Bollinger Bands Stop RSI Filter trading system for the serious day traders. This is the best way to learn Forex trading with trend and momentum indicators.

Heiken Ashi candlesticks are a unique charting method which get attached to your standard price chart on your trading terminal.
Every trader heard of candlesticks.
But not all traders heard of a Heiken Ashi chart.
To know how to read Heiken Ashi Candles, one needs to understand the concept first.
Heikin-Ashi chart looks like the candlestick chart but the method of calculation and plotting of the candles on the Heikin-Ashi chart is different from the candlestick chart.
Take a look at the image below…
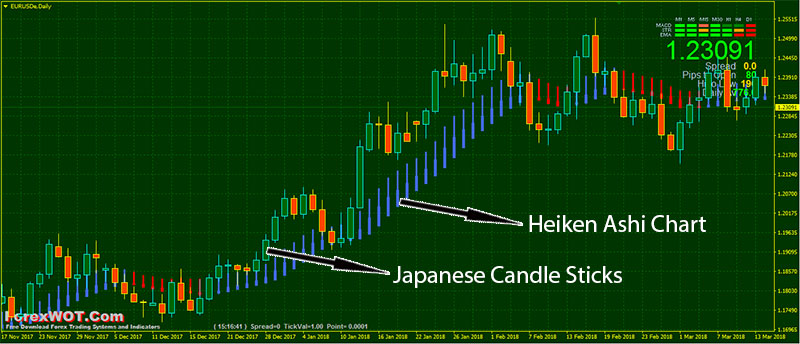
The purpose of HA charts is to filter noise and provide a clearer visual representation of the trend.
For new traders, the trend is easier to see, and for experienced traders, the HA charts help keep them in trending trades and able to spot reversals, while still being able to see traditional chart pattern setups.
In candlestick charts, each candlestick shows four different numbers:
- Open
- Close
- High
- …and Low price.
The Heiken-Ashi candles are different and each candle is calculated and plotted using some information from the previous candle:
- The Close price: Heikin-Ashi candle is the average of open, close, high and low price.
- Open price: Heikin-Ashi candle is the average of the open and close of the previous candle.
- High price: the high price in a Heikin-Ashi candle is chosen from one of the high, open and close prices of which has the highest value.
- Low price: the high price in a Heikin-Ashi candle is chosen from one of the high, open and close prices of which has the lowest value.
Heikin-Ashi candles are related to each other because the close and open price of each candle should be calculated using the previous candle close and open price and also the high and low price of each candle is affected by the previous candle.
Heikin-Ashi chart is slower than a candlestick chart and its signals are delayed (like when we use moving averages on our chart and trade according to them).
This could be an advantage in many cases of volatile price action.
This day trading strategy is very popular among traders for that particular reason.
It’s also very easy to recognize as trader needs to wait for the daily candle to close. Once the new candle is populated, the previous one DOESN’T RE-PAINT.
You can access Heikin-Ashi indicator on every charting tool these days.
Heikin Ashi charts calculate their own open (HAO), high (HAH), low (HAL) and close (HAC) using the actual open (O), high (H), low (L) and close (C) of the time frame (1 minute, 5 minute, 15 minute, etc.).
Calculation:
- HAO = (Open of previous bar + Close of previous bar) / 2
- HAC = (Open + High + Low + Close) / 4
- HAH = Highest of High, Open, or Close
- HAL = Lowest of Low, Open, or Close
There is a mathematical formula for calculating each price bar on a Heikin Ashi chart.
Because of this, you don’t know the EXACT PRICE a time period opened or closed at.
When day trading, this can be an issue, since knowing the exact price–especially when trading off a chart–is important.
For longer-term traders, this is less of an issue since the open and close of a price bar are not as important in trades that last months or years.
In this article, I’ll show you how to use Heiken Ashi for the day traders.
Let’s go to the trading system…
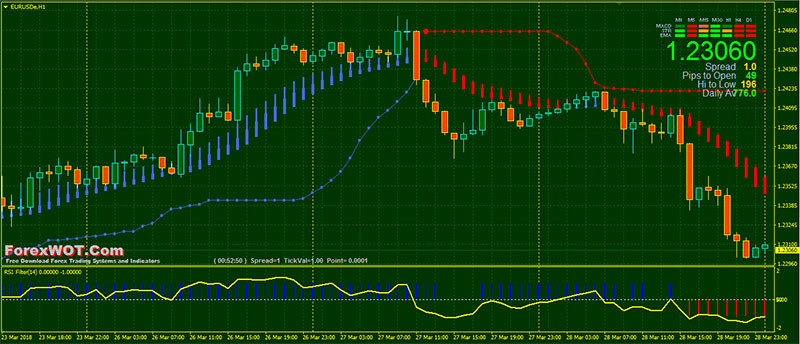
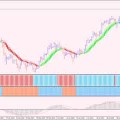
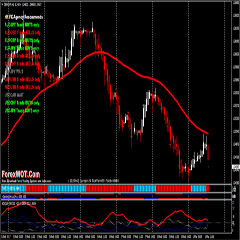
High accuracy Forex Heiken Ashi Bollinger Bands Stop (HABBS) RSI Filter Trading System for day traders.
- Time Frames: M30 and H4
- Most Recommended Currency Pairs: GBPUSD, EURUSD
- HBH Trend
- HBB Stop
- Signal Trend
- RSI Filter
- RSI Line

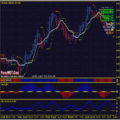
- TimeFrame: H1 or M30
- HBH Trend (Heike Ashi chart) blue color
- HBB Stop blue color
- RSI Filter blue color
- RSI Line upward and above 50
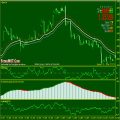
- TimeFrame: H1 or M30
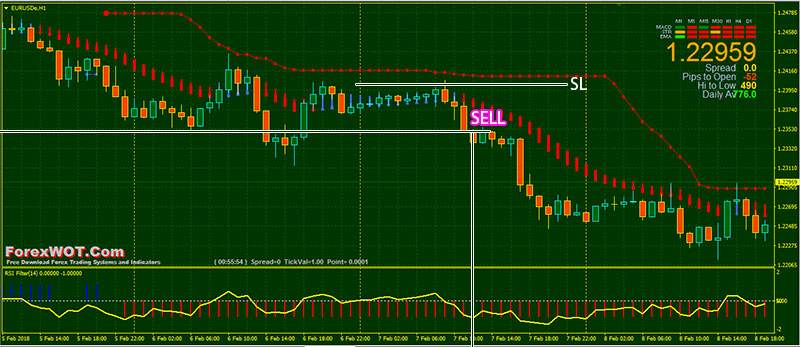
- HBH Trend (Heike Ashi chart) red color
- HBB Stop red color
- RSI Filter red color
- RSI Line downward and above 50
- The Heiken Ashi indicator is great for riding trends. Not for picking up reversals.
- A realistic risk-reward ratio for the Forex market is anywhere between 1:2 and 1:3. That means for every pip risked, the expectation is to make at least two or two and a half in profit.
- When combined with strong discipline and money management, the resulting trades might be quite amazing.
 Top 10 Super Effective High Profits Forex Heiken Ashi Trading System and Strategy
 How to succeed at Forex Trading with Heiken Ashi Laguerre Trading System and Strategy (HeikenAshi)
 Super Effective Follow Trend Trading with Heiken Ashi Profit Supreme
 Advanced Trend Trading With Smoothed Heiken Ashi Candlesticks
 Learn Online Forex Trading – How To Easily Trade Forex With Heiken Ashi
 ZMA Heiken Ashi System – Easy Way To Identify The Direction Of The Trend
 Forex Heiken Ashi Moving Average Trading System with Multi MACD and QQE Period Indicator (MACD)
 Forex Trading Course – How To Trade Foreign Exchange Market With TREND SQUEEZER Heiken Ashi Trading System
 Heiken Ashi ADX System – Best Forex Trading Strategy for Consistent Profits
 FREE DOWNLOAD 20+ Best Forex MACD-Moving Average Trading System
