Easy simple forex daily time frame trading with Advanced Parabolic trend following system and strategy. The trading system is a simple trend following strategy for intraday trading and swing (Daily is the most recommended time frame).

The main feature of this “Advanced Parabolic Trend Following System and Strategy” is to have a good profitability to be trend following and be based on the Parabolic Sar.
The Parabolic Sar is an ‘all-in-one’ indicator, a stop-placement guide and a trading system which keeps the trader in the market at all times.
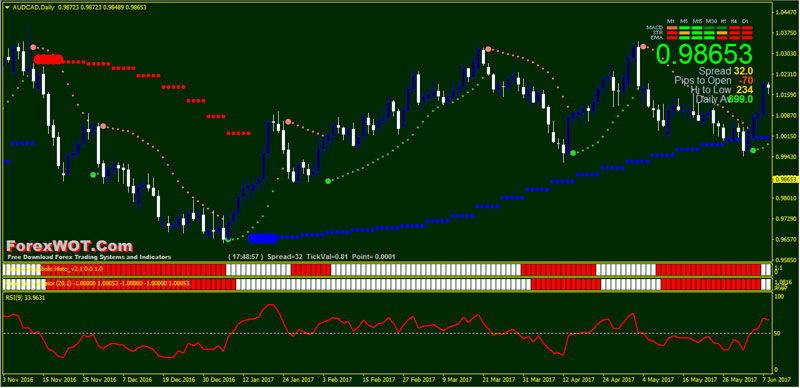
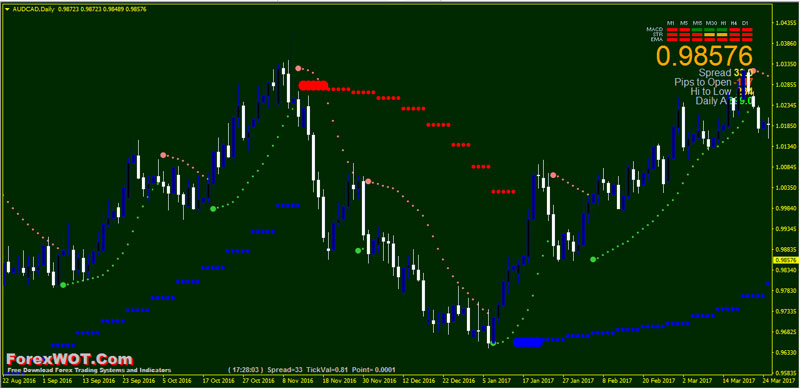
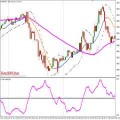
The indicator appears as a series of dots underneath or above the price action, with a dot a certain distance under or over each bar. The dots start quite far away from the price at the at the beginning of a new trend and then move closer, forming a Parabolic-looking gradient.
The dots start quite far away from the price at the at the beginning of a new trend and then move closer, forming a Parabolic-looking gradient.
At certain points, the dots cross over and move from under to over or vice-versa, and this cross marks a reversal in trend.
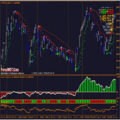
As can be seen in the chart above the system seems to work quite well at a glance, getting the traders in and out of positions in quite a timely fashion. The Parabolic SAR works best on the weekly chart.
Parabolic SAR introduces some excellent concepts to technical analysis but leaves two major weaknesses:
- Trend speeds vary over time and between stocks or currency pairs. It is difficult to arrive at one acceleration factor that suits all trends — it will be too slow for some and too fast for others.
- The SAR system assumes that the trend changes every time a stop has been hit. Any trader will tell you that your stops may be hit several times while the trend continues. Price merely retraces through your stop and then resumes the uptrend, leaving you lagging behind.
Parabolic SAR should only be employed in trending markets – when it provides useful entry and exit points. And this “Daily-Weekly Advanced Parabolic Trend Following Strategy” is your best Parabolic SAR system.
- Best Time Frames: Daily (Short Term SWING Trading)
- Recommended Currency Pairs: GBPUSD, EURUSD, and all major pairs
- Advanced Parabolic Sar
- Signal Trend
- Adaptive Parabolic HISTO
- Deep Bar Indicator
- Relative Strength Index
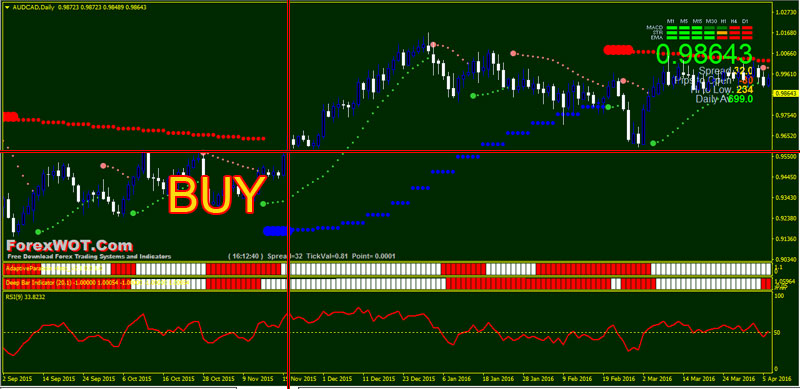
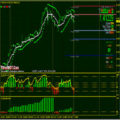
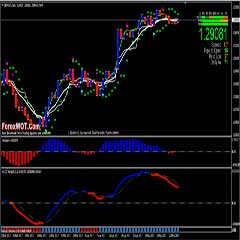
- Advanced Parabolic Sar Weekly Time Frame Blue color
- Advanced Parabolic Sar Daily Time Frame Green color
- Adaptive Parabolic HISTO white color
- RSI line upward and above 50 level

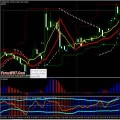
- Advanced Parabolic Sar Weekly Time Frame Red color
- Advanced Parabolic Sar Daily Time Frame Yellow color
- Adaptive Parabolic HISTO Red color
- RSI line downward and below 50 level
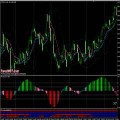
- Exit position is discretionary or…
- Place an initial stop loss 3 pips below/above the Parabolic SAR “dots” of entry bar with take profit stop loss ratio 1:2 or 1:3.
- Speculative Money Management:
- This system has a good distribution of profitability, this feature allows a speculative management of lots: 0:01 0:02 – 0:03 0:04 – 0.05 – 0.06 -0.07 …… or with martingale with multiplier 1.3 ( 0.01, 0.02, 0.03, 0.05, 0.08, 0.13, 0.20, 0.28, 0.36).
 The Best Forex Binary Options Parabolic Sar Strategy with TDI and Escalda Trend Signal Indicator
 Forex High Profits High Accuracy Parabolic SAR System with Simple Moving Average and ATR Ratio (SAR)
 Forex Parabolic SAR Trading Strategy with Day Week Month Range Indicator
 Forex Parabolic SAR (Stop And Reversal) Trading System : How To Use Parabolic SAR Indicator Effectively
 The Most Successful Forex Super Signals Channel Trading System with Parabolic SAR and Fractal (CHANNEL)
 Forex MultiTimeFrame Parabolic SAR Trading System With TMA Slope Filter
 Forex Trend CCI Super Adaptive Parabolic Trading Strategy
 Foreign Exchange Currency Trading & Investment Strategy – Forex Z 20 System for Successful and Highly Profitable Forex Trader
 High Accuracy Forex Trading Strategy Based on the MACD and Parabolic SAR Indicator
 BEST TOP 5 Simplest Major Pairs GBPUSD and EURUSD Forex Trading Strategy
