Forex Harmonic Patterns and Trading Strategy – Harmonic price patterns take geometric price patterns to the next level by using Fibonacci numbers to define precise turning points.

Unlike other trading methods, Harmonic trading attempts to predict future movements.
This is in vast contrast to common methods that are reactionary and not predictive.
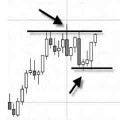
Harmonic price patterns are extremely precise, requiring the pattern to show movements of a particular magnitude in order for the unfolding of the pattern to provide an accurate reversal point.
Harmonic patterns can gauge how long current moves will last, but they can also be used to isolate reversal points. The danger occurs when a trader takes a position in the reversal area and the pattern fails.
When this happens, the trader can be caught in a trade where the trend rapidly extends against them. Therefore, as with all trading strategies, risk must be controlled.
There is quite an assortment of harmonic patterns, although there are four that seem most popular.
These are the Gartley, butterfly, bat and crab patterns.
The Gartley was originally published by H.M. Gartley in his book Profits in the Stock Market and the Fibonacci levels were later added by Scott Carney in his book The Harmonic Trader.

The bullish pattern is often seen early in a trend, and it is a sign the corrective waves are ending and an upward move will ensue at point D.
All patterns may be within the context of a broader trend or range and traders must be aware of that (see Elliott Wave Theory).
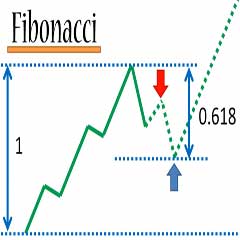
Point D is a 0.786 correction of the XA wave, and it is a 1.27 or 1.618 extension of the BC wave.
The area at D is known as the potential reversal zone (PRZ).
This is where long positions could be entered, as some price confirmation of reversal is encouraged. A stop is placed just below the PRZ.
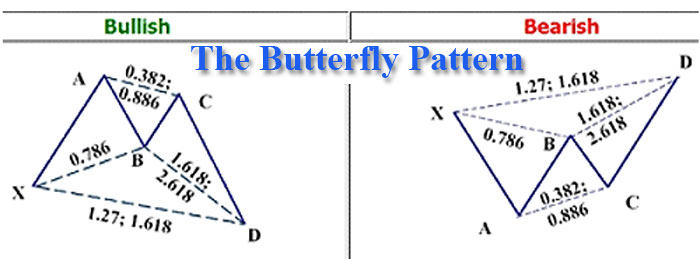
The butterfly pattern is different than the Gartley in that it focuses on finding reversals at new lows (bullish) or new highs (bearish).
D is a new low and a potential reversal point if the Fibonacci figures align with the structure.
D would need to be an extension of BC in the magnitude of 1.618 or 2.618.
This should align with an extension of XA in the magnitude of a 1.27 or 1.618. Entry is taken near D with price confirmation of the reversal encouraged.
Stops are placed slightly below the potential reversal area (bullish).
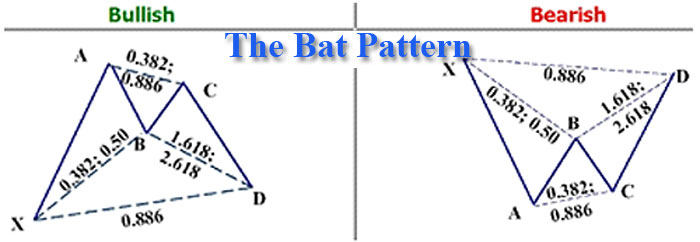
The bat pattern is similar to Gartley in appearance, but not in measurement.
Point B has a smaller retracement of XA of 0.382 or 0.50 (less than 0.618), but the extension of the BC wave into D is at minimum 1.618 and potentially 2.618. Therefore, D will be a 0.886 retracement of the original XA wave.
This is the PRZ: when selling has stopped and buying enters the market, enter a long position and take advantage of the bullish pattern.
Place a stop just below the PRZ.
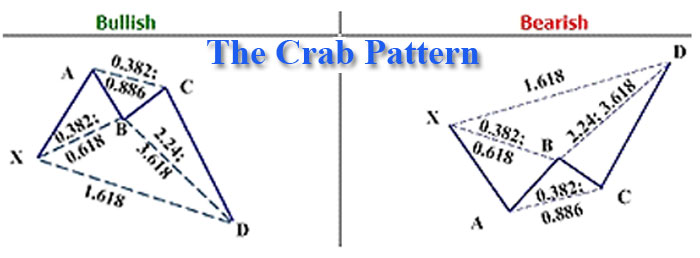
The crab pattern is considered by Carney to be one of the most precise of the patterns, providing reversals in extremely close proximity to what the Fibonacci numbers indicate.
This pattern, similar to the butterfly, looks to capture a high probability reversal at a new (recent) low or high (bullish or bearish respectively). In a bullish pattern, point B will pullback 0.618 or less of XA.
The extension of BC into D is quite large, from 2.24 to 3.618.
D (the PRZ) is a 1.618 extension of XA.
Entries are made near D with a stop-loss order just outside the PRZ.
Harmonic trading is a precise and mathematical way to trade, but it requires patience, practice and a lot of studies to master the patterns.
Movements that do not align with proper pattern measurements invalidate a pattern and can lead traders astray.
The Gartley, butterfly, bat, and crab are the better-known patterns that traders can watch for.
Entries are made in the potential reversal zone when price confirmation indicates a reversal, and stops are placed outside the nearest significant (for the pattern) Fibonacci level that was not hit by the BC or XA extensions/retracements into the D (PRZ) area.
[sociallocker]
[/sociallocker]
 Forex Magic Breakout EMA CCI Trading – Maximize Your Profits and Achieve Exponential Earnings
 Foreign Exchange Trading : Online Forex Master Level Trading System and Strategy
 Improve Your Forex Trading Strategy With 3 Best Fibonacci Trading Systems
 Simple Effective Forex Cloud With ABCD Pattern Trend Following Strategy
 STOCHASTIC Trend Reversal Trading System : How to Identify And Trade Trend Reversals in Sideways Forex Market
 High Probability Trend-Reversal 5 EMA High/Low Trading Strategy
 The Easiest Way To Trade 3 Most Powerful Chart Pattern with CCI Trend Bars and Gann SSL Indicator
 Forex Magic Breakout – Using the CCI Indicator to Find and Filter Trades
 Mapping Forex Price Action Trading Strategy
 Best Forex Trading Technique For Catching Trend Changes
