High Accuracy Forex – How to Analyse Forex Market Charts with EMA21 Trend Channel Daily Trading System. EMA21 Trend Channel Daily Trading System is trending strategy based on more with Super High Accuracy trend confirmation indicators.

Moving averages are one of the most commonly used technical indicators in stock, futures and forex trading.
Moving averages are utilized as trend indicators and to identify significant support and resistance levels. Traders and market analysts watch for crossovers of longer-term moving averages by shorter-term moving averages as possible indicators of
Traders and market analysts watch for crossovers of longer-term moving averages by shorter-term moving averages as possible indicators of a trend change in intraday trading and in regard to long-term trends.
There are numerous variations of moving averages. They can be calculated based on closing price, opening price, high price, low price or a calculation combining those various price levels. Most moving averages are some form of either the simple moving average (SMA), which is just the average price over a given time
Most moving averages are some form of either the simple moving average (SMA), which is just the average price over a given time period or the exponential moving average (EMA), which is designed to respond more rapidly to recent price changes.
The 14 days LSMA and 21 days EMAs on the daily charts to help with trend identification and dynamic support and resistance identification. Both the 14 LSMA and 21 EMAs are factors or levels that can add confluence to a price action setup.
- 21 Exponential Moving Average
- FX Sniper’s LSMA(14)
- Heiken Ashi Candles
- SEFC 10
- Signal Trend
- Non Lag Dot Alert Histograms
- QQE ADV
- Booster Power
- THV4 Trix
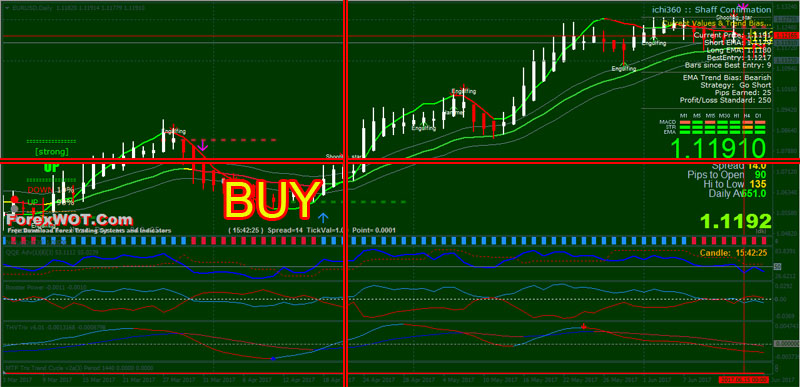
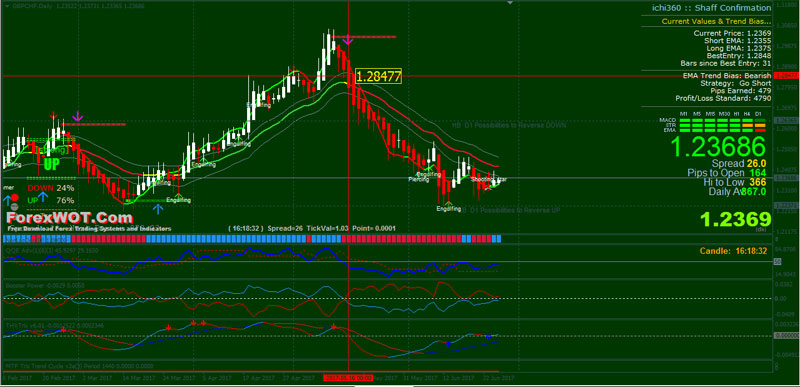
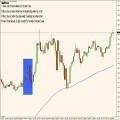
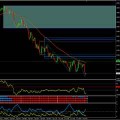
- 21 Exponential Moving Average CHANNEL upward
- FX Sniper’s LSMA(14) green color line
- Heiken Ashi candles white color
- SEFC 10 green color at swing low
- Signal Trend green bars
- Non Lag Dot Alert Histograms blue color
- QQE ADV blue line above red line
- Booster Power upward blue line above downward red line
- THV4 Trix blue lines and above 0 level
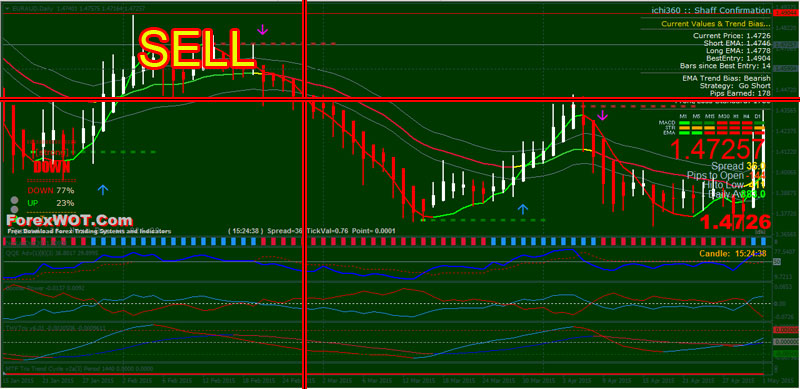
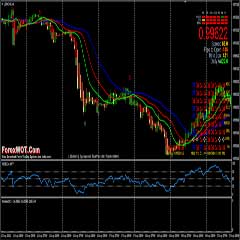
- 21 Exponential Moving Average CHANNEL downward
- FX Sniper’s LSMA(14) red color line
- Heiken Ashi candles red color
- SEFC 10 red color at swing high
- Signal Trend red bars
- Non Lag Dot Alert Histograms red color
- QQE ADV blue line below red line
- Booster Power downward blue line below upward red line
- THV4 Trix red lines and below 0 level
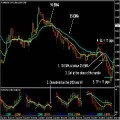
- Initial Stop Loss at previus swing
- Exit when Heiken Ashi candles red color (for BUY) and Heiken Ashi candles white color (for SELL)
 How Do I Become a Good and Prifitable Forex Trader
 Foreign Exchange Currency Trading & Investment Strategy – Forex Z 20 System for Successful and Highly Profitable Forex Trader
 High Accuracy Volty Channel Stop RSI Trading Strategy and How to Win Consistently in Forex Trading
 Forex Bill Williams Market Facilitation Index (BW MFI) Multi Trend Trading System and Strategy
 High Probability Trading: The 10 Pips Forex Trading Strategy
 Sure Forex Breakout System Absolutely Amazing and Easy Forex Strategy
 EASY Forex H1 IntraDay Trading System With Bill Williams Alligator Multi Trend Signal
 High Profit Simplified Donchian Channels Turtle Trading System
 Simple Powerful and Effective Forex Price Action Trading Strategy Using Moving Average
 Forex Breakout Trading Strategy with CCI and ADX
