Forex Support Resistance Trading – The Best Support and Resistance Levels Trading with Forex Strategist SR indicator. Today I am going to give a lesson on how to find some of the best support and resistance levels in the market using Forex Strategist SR indicator.

One of the more difficult concepts within Technical Analysis is grasping the premise of Support and Resistance. There are numerous ways to identify these levels, and even after identified, there are a plethora of ways of integrating and trading with them.
Support & Resistance systems are designed for sideways or directionless markets, and they typically have the following attributes:
- They BUY Low and SELL High in an attempt to take advantage of the sideways price movement characterizing directionless markets.
- They have a high number of winning trades.
- They are easier to trade emotionally.
The system keeps shorting a market that is in an uptrend or buying a market that is in a downtrend. Therefore, when traders use Support &Resistance systems, they use them within a group of systems that also includes trending systems and perhaps one or more volatility systems.
This is the best and very easy Support-Resistance Levels Trading System with Forex Strategist SR indicator.
This system is not the holy grail but help you at the gain pips.
- Best Time frames: 15 min or higher
- Recommended Currency Pairs: EURUSD, GBPUSD, USDJPY, and all Major Pairs
- Forex Strategist SR indicator
- Tenkan-Sen Ichimoku Kinko Hyo
- 3 Level ZZ Semafor
- Signal Trend
- JMO V5 Stoch
- William’s Percent Range
- Trend Arrows

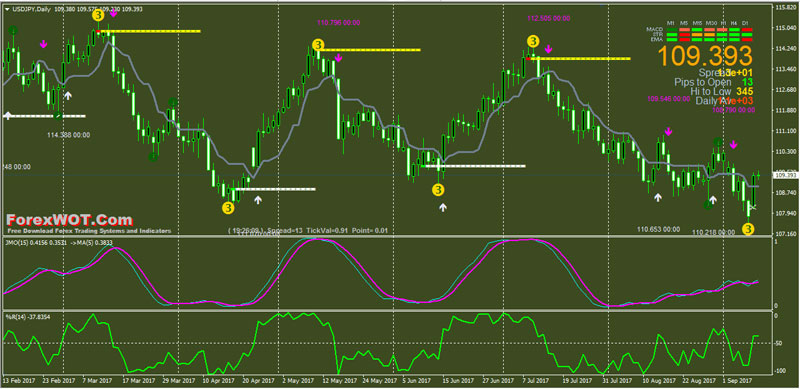
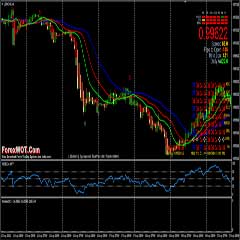
- Price upward above Forex Strategist SR indicator (White color line)
- Price above Tenkan-Sen Ichimoku Kinko Hyo
- 3 Level ZZ Semafor Yellow color number 3 circle below the price (previous swing low)
- Signal Trend Green color bars
- JMO V5 Stoch bullish
- William’s Percent Range line upward above -50 level
- Trend Arrows White color below the price
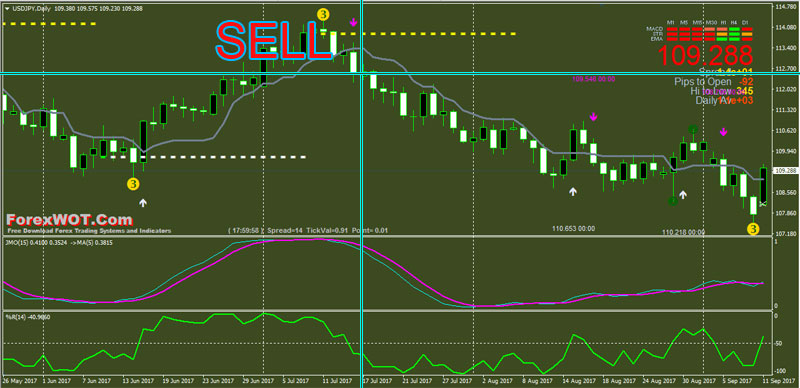
- Price downward below Forex Strategist SR indicator (Yellow color line)
- Price below Tenkan-Sen Ichimoku Kinko Hyo
- 3 Level ZZ Semafor Yellow color number 3 circle above the price (previous swing high)
- Signal Trend Red color bars
- JMO V5 Stoch bearish
- William’s Percent Range line downward below -50 level
- Trend Arrows Magenta color above the price
- Capital management and limiting your losses are of paramount importance.
- Initial Stop Loss above or below Forex Strategist SR indicator
- Stop Loss Take Profit ratio = 1:2 or 1:3
- This trading plan isn’t complicated
[sociallocker]
[/sociallocker]
 How Do I Become a Good and Prifitable Forex Trader
 Foreign Exchange Currency Trading & Investment Strategy – Forex Z 20 System for Successful and Highly Profitable Forex Trader
 High Accuracy Volty Channel Stop RSI Trading Strategy and How to Win Consistently in Forex Trading
 Best Forex & Stocks Trading Strategy with Dolly-Graphics System
 Forex Bill Williams Market Facilitation Index (BW MFI) Multi Trend Trading System and Strategy
 Forex and Crypto “MORNING TRADE” Trading Strategy for Advanced Traders
 High Probability Trading: The 10 Pips Forex Trading Strategy
 Sure Forex Breakout System Absolutely Amazing and Easy Forex Strategy
 EASY Forex H1 IntraDay Trading System With Bill Williams Alligator Multi Trend Signal
 Simple Powerful and Effective Forex Price Action Trading Strategy Using Moving Average

It means it is time to cut the trade. When you back test it, you will see when you see the scissors, if you are in a buy trade, price most likely will be shifting down, so better to take your profits and wait for the next signal. How has it been working for you so far
Hello, I need information on the strategist indicator. When it shows a white scissors like image, what does this mean? Thanks for the information
I did not get download link after I liked the page on fb