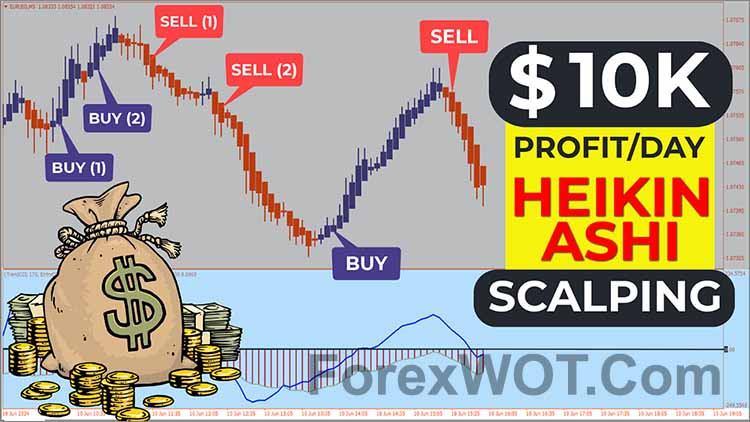
Scalping is considered one of the quickest ways to earn profits in the forex and stock markets. It’s believed to be the most effective method for boosting a trader’s capital. In this video, we’ll discuss the 1-minute and 5-minute scalping trading technique and delve into every aspect of this strategy.

This highly efficient scalping strategy is straightforward and can be implemented right away. It’s versatile and works across all financial markets, suitable for short time frames like the 1-minute chart as well as longer time frames.
The Heiken Ashi Scalping Strategy offers intriguing features that smooth price movements, enabling the creation of various effective systems and strategies suitable for different time frames.
Next, I’ll explain a straightforward multi-timeframe trading strategy that can be applied especially to Forex and Stock Markets.
Heiken Ashi Scalping Strategy Configuration
- Heikin Ashi Candles Indicator
- Trend CCI Indicator
Important Details Before Trading:
- The Heikin Ashi with Trend CCI Strategy operates based on trend momentum.
- The signals from the Trend CCI histogram indicate buy or sell opportunities but do not directly trigger entries.
- Ensure the Trend CCI histogram and Trend CCI line align.
- Utilize Heikin Ashi for identifying trade setups.
- Download “ForexWOT-HeikinAshiTrendCCI” (Zip/RAR File).
- Copy mq4 and ex4 files to your Metatrader Directory …/experts/indicators/
- Copy the “ForexWOT-HeikinAshiTrendCCI.tpl” file (template) to your Metatrader Directory …/templates /
- Start or restart your Metatrader Client.
- Select Chart and Timeframe where you want to test your forex system.
- Right-click on your trading chart and hover on “Template”.
- Move right to select “ForexWOT-HeikinAshiTrendCCI” trading system and strategy.
- You will see the “ForexWOT-HeikinAshiTrendCCI” is available on your Chart.
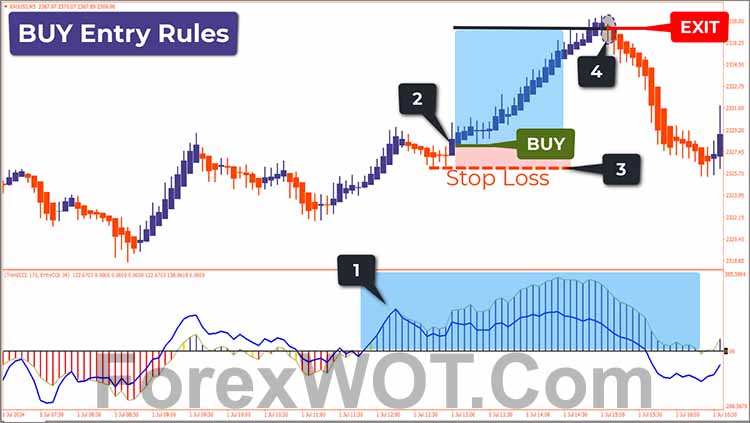
- 1st. The Trend CCI histogram and Trend CCI line above the 0 level.
- 2nd. The entry is confirmed when the Heikin Ashi candle turn bullish after the retracement.
- 3rd. The Stop Loss is placed in the minimum recent low.
- 4th. exit trade when the Heikin Ashi candles change from blue to red.
This is the brilliance of Heikin Ashi candles, which traditional Japanese candlesticks do not possess.
Heikin Ashi candles clearly provide trading signals, making it easy and precise to enter the market. By using the CCI indicator, we enhance the accuracy of our trades, making this strategy reliable due to its ease of application and high trading signal accuracy.
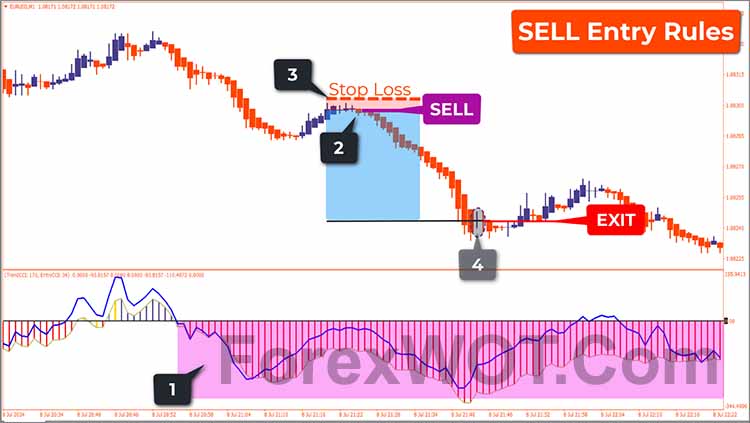
Now let’s see how this strategy provides accurate SELL signals.”
- 1st. The Trend CCI histogram and Trend CCI line below the 0 level.
- 2nd. The entry is confirmed whe the Heiken Ashee candle turn bearish after the retracement.
- 3rd. The Stop Loss is placed in the minimum recent high.
- 4th. exit trade when the Heikin Ashi candles change from red to blue.
Scalping trading tips. Successful scalping relies on you being passionate about what you’re doing and willing to invest time into monitoring the markets and developing the best strategy.
This is because you’ll need to wait for the market conditions to give you signals to decide whether to go short or long. Most scalping traders work on small timescales such as 15 minute, 5 minute and 1-minute charts.
To enjoy returns from scalping you’ll need to develop the skills to be able to quickly execute orders and close open positions. Gaining an understanding of when to make a move whilst day trading is crucial, too.
Choosing the right market is also important. in forex market, lookout for pairs where nextmarkets offer low spreads to make the most of your forex scalping.
Understanding Money Flow Index (MFI) analysis is crucial for successful trading. It’s the backbone of making informed decisions and ultimately earning maximum profits in any market.
Without a solid grasp of Money Flow Index and Market Trend analysis, you might find yourself losing money or struggling to grow your investments.
So, I’m here to reveal everything about the Money Flow Index and the best Moving Average setups that you probably never knew. We will thoroughly examine the Money Flow Index, determine the best Moving Average settings when combined with the Money Flow Index, read candlestick charts, identify the best support and resistance levels, recognize trends, and execute entry patterns correctly.
I’ve condensed over a decade of my trading experience into this one comprehensive guide. And best of all, it’s free! So, hit that like button to support the channel and subscribe if you’re new here. Let’s dive in and boost your trading skills together!
- Download “ForexWOT-EMAMFI(Price-Action)” (Zip/RAR File).
- Copy mq4 and ex4 files to your Metatrader Directory …/experts/indicators/
- Copy the “ForexWOT-EMAMFI(Price-Action).tpl” file (template) to your Metatrader Directory …/templates /
- Start or restart your Metatrader Client.
- Select Chart and Timeframe where you want to test your forex system.
- Right-click on your trading chart and hover on “Template”.
- Move right to select “ForexWOT-EMAMFI(Price-Action)” trading system and strategy.
- You will see the “ForexWOT-EMAMFI(Price-Action)” is available on your Chart.
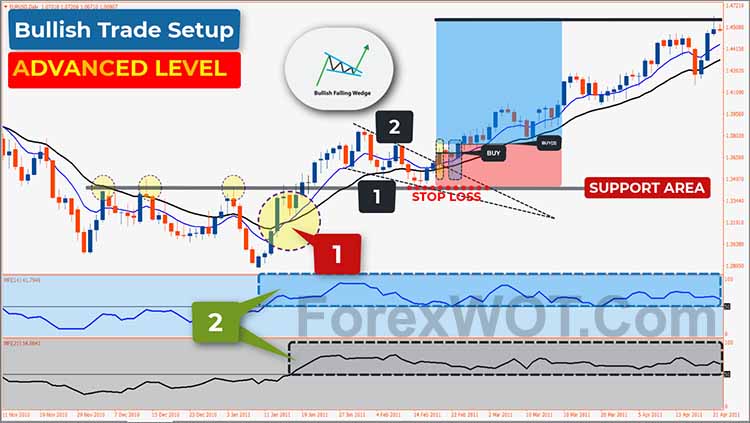
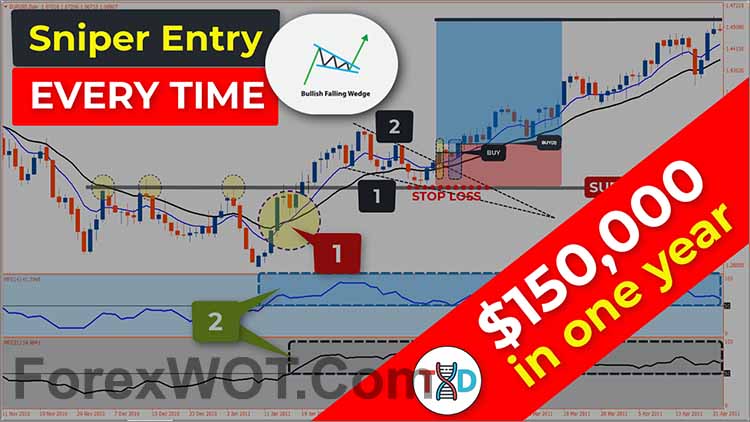
Place BUY orders when these conditions are fulfilled.
- 1st. the blue 9-period EMA line crosses above the black 21-period EMA line.
- 2nd. the blue 9-period MFI line and the black 21-period line are above the 50 level.
So, Here are the price action confirmations that strengthen the likelihood of our trade position being successful;
- 1st. The price shows a bounce upwards after reaching a support area. This is the first sign that the trend is continuing its bullish direction. Such conditions often occur in the market. So, if you encounter this situation, be prepared to open a position in the direction of this ongoing trend.
- 2nd. “A Bullish Falling Wedge has formed, which means it’s also a bullish signal in the price action chart pattern because the price has already broken the resistance trend line of this pattern. After at least two price action confirmations have appeared, we can consider opening a BUY position. So, in this case, once the candle that breaks above the resistance trend line closes as a bullish candle. You can consider opening a BUY position. Don’t forget to place a stop loss below the nearest swing low.”
- 3rd. Turns out, another bullish pin bar formed followed by a bullish engulfing bar. So, you can open a second BUY position with a stop loss below the nearest swing low.
Indeed, this trade resulted in significant profits because two consecutive price action signals formed while the Money Flow Index and Exponential Moving Average indicated a valid bullish trend.
Based on my experience, the more price action confirmations that gather around a trading signal, the greater the chance that our trade position will be profitable. Therefore, do not overlook price action analysis in this strategy. Once you’ve identified a valid trend after completing the first and second steps, if I find multiple price action confirmations or confluence following these criteria, I seriously consider making a larger transaction.
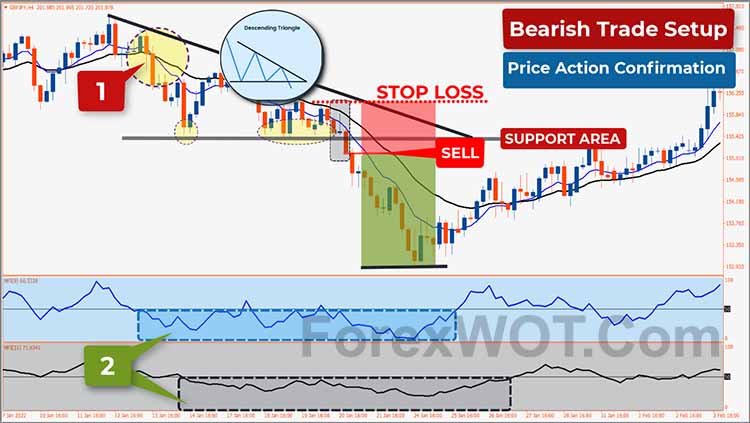
Place SELL orders when these conditions are fulfilled.
- 1st. the blue 9-period EMA line crosses below the black 21-period EMA line.
- 2nd. the blue 9-period MFI line and the black 21-period line are below the 50 level.
After the price movement meets the first and second trading rules, the market is categorized as validly bearish. The next step is to conduct price action analysis to identify high probability SELL signals.
So, Here are the price action confirmations that strengthen the likelihood of our trade position being successful;
- 1st. A strong support area is formed.
- 2nd. A bearish pin bar is followed by a penetration of the strong support area by a bearish marubozu candle.
- 3rd. A descending triangle pattern forms, indicating a potential bearish trend if the support area of this triangle pattern is successfully breached by a bearish candle. In this case, the support area has already been breached by a bearish marubozu candle.
Unlike the first example that illustrated a high probability BUY signal, this is a high probability SELL signal. If I come across a trading signal like this or similar to it, I would consider entering a larger position because the likelihood of achieving substantial profits is very high.
 EMA-MOMENTUM Forex & Stock Trading Strategy
 The Best Way to Learn Forex Trading
 20 Halloween Costumes From Amazon All Traders will Actually Want To Wear
 Top 10 BEST Forex Trading Strategy and Indicators
 MA COBRA Forex & Stocks Trading Strategy (Extremely Low Risk High Reward Trading Strategy) (COBRA SYSTEM)
 2 MACD Effortless Forex & Stocks Swing Trading Strategy
 Best LWMA Trading With MACD & STOCHASTIC Filter
 Top 10 Super Effective High Profits Forex Heiken Ashi Trading System and Strategy
 Top 7 BEST Heiken Ashi Smoothed Trading Strategy
 Stocks and Currency Trading With GUPPY Multiple Moving Averages Trading System
