The “Demand Index Divergence” Indicator is a trading system that derives its name from its function, which is to detect divergences in demand. It can be applied to both trend following and reversal trading setups, making it a valuable tool for traders.

This system relies on the Moving Average of price data to determine whether bullish or bearish momentum is gaining or losing strength, providing investors with crucial insights into market movements.
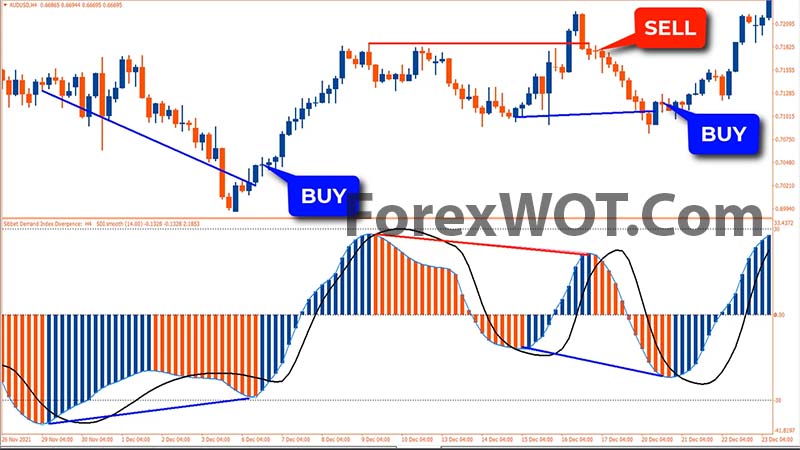
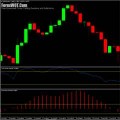
The “Demand Index Divergence” indicator is a popular tool used by traders to identify divergences in demand. It is displayed in the form of a histogram, which graphs the difference between two moving averages of price data. Another moving average, known as the signal line, is then applied to this histogram.
So, how does it work?
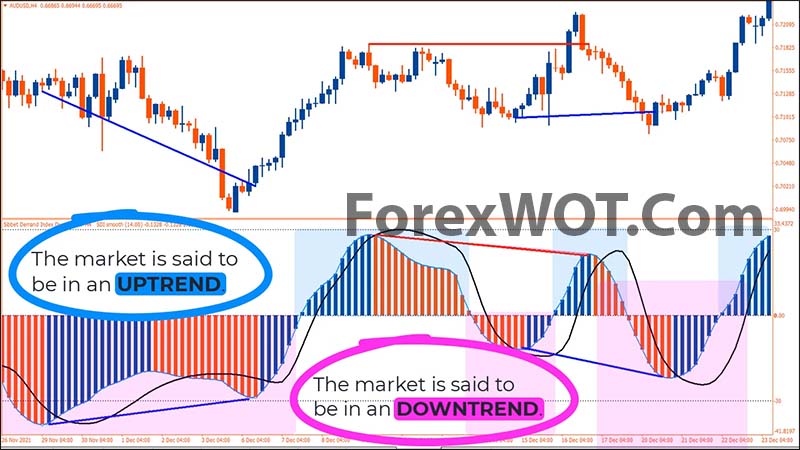
When the histogram formation is above the zero line, the market is said to be in an uptrend. Conversely, when the histogram formation is below the zero line, the market is considered to be in a downtrend. The crossover of the histogram line and the signal line is also an indication of a potential change in the direction of the trend.
In summary, the “Demand Index Divergence” indicator can be a useful tool for traders looking to identify trend-following and reversal trading setups. By analyzing the moving averages of price data, this indicator provides valuable insights into whether bullish or bearish momentum is gaining or losing strength. Keep watching to learn more about how to use this indicator in your trading strategies.
Despite its high accuracy and dependable trading signals, this strategy is straightforward and uncomplicated, making it easy to comprehend, even for novice traders such as yourself.
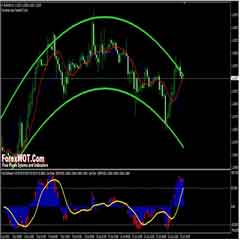
The key is to observe the consistency of trends among these three indicators. When you identify confluence with price action signals like chart patterns, candlestick patterns, trendline breaks, or key support & resistance, this situation will enhance the accuracy of your trading signals even further.
- Download “ForexWOT-34EMADemandIndexDivergence” (Zip/RAR File).
- Copy mq4 and ex4 files to your Metatrader Directory …/experts/indicators/
- Copy the “ForexWOT-34EMADemandIndexDivergence.tpl” file (template) to your Metatrader Directory …/templates /
- Start or restart your Metatrader Client.
- Select Chart and Timeframe where you want to test your forex system.
- Right-click on your trading chart and hover on “Template”.
- Move right to select “ForexWOT-34EMADemandIndexDivergence” trading system and strategy.
- You will see the “EMA – Demand Index Divergence” is available on your Chart.
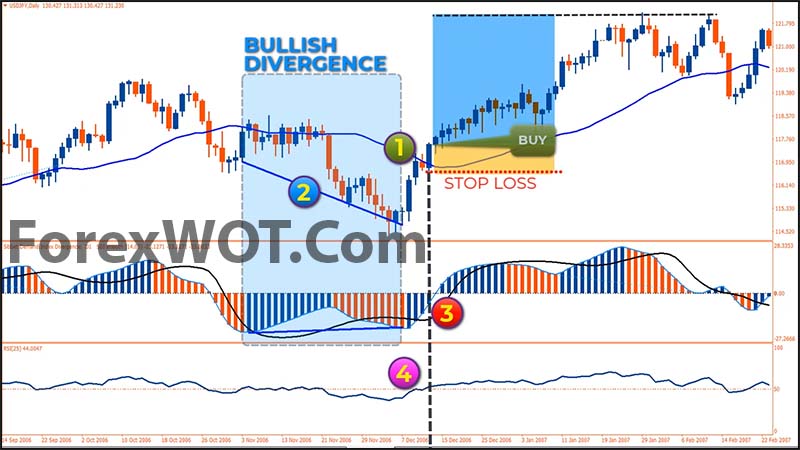
The following are the conditions to be met for making a BUY:
It should be noted that the signals generated by this strategy do not appear frequently, so you must be patient in waiting. Nevertheless, the accuracy of the trading signal you are waiting for is quite high, so the result is worth your effort.
- 1st. The 34-period EMA has been surpassed by the price.
- The Divergence formed before the price crosses above the 34-period EMA.
- 3rd. The histogram for “Demand Index Divergence” is displaying a blue color.
- 4th. The RSI crosses over the 50 level.
Stop LOSS:
Sett stop loss order below the nearest swing low, or below 34-EMA Line. By setting a stop loss order below the nearest swing low, traders aim to protect their position in case the price starts moving against their trade.
However, it’s important to note that this stop loss strategy is not foolproof and can still result in losses if the market experiences sudden and unexpected volatility. Therefore, you must also consider other factors such as your risk tolerance, market conditions, and trading plan when setting your stop loss orders.
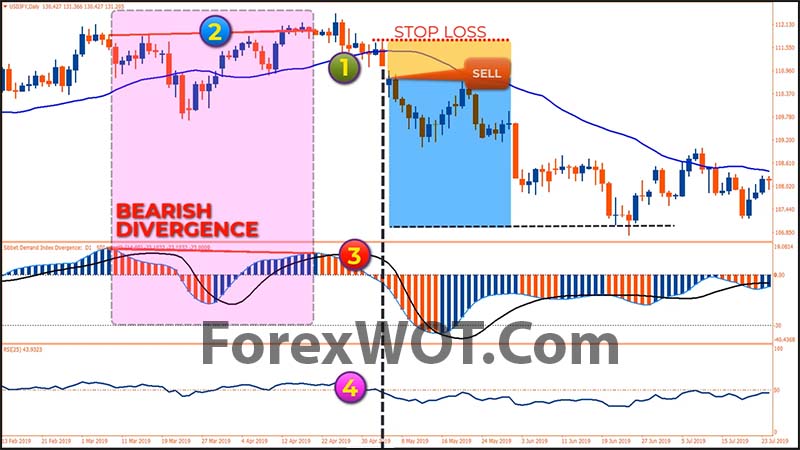
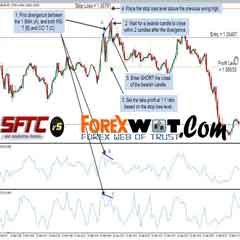
The following are the conditions to be met for making a SELL:
- 1st. The price breaks below the 34-period EMA from above.
- 2nd. The price is currently trading below the 34-period EMA.
- 3rd. The histogram for “Demand Index Divergence” displays a red color.
- 4th. The RSI crosses the 50 level from above to below.
Stop LOSS:
Sett your initial stop loss order above the nearest swing high, or above the 34-period EMA line.
The signals produced by this strategy may not occur frequently, which requires you to be patient while waiting. However, the accuracy of the trading signal that you are anticipating is relatively high, so the outcome is worth the wait.
 2 MACD Effortless Forex & Stocks Swing Trading Strategy
 MA COBRA Forex & Stocks Trading Strategy (Extremely Low Risk High Reward Trading Strategy) (COBRA SYSTEM)
 FREE DOWNLOAD 20+ Best Forex MACD-Moving Average Trading System
 Foreign Exchange Trading : Online Forex Master Level Trading System and Strategy
 FOREX 1 MIN Scalping Trading Tricks By The Most Successful Forex Trader
 Forex Trading Short Course – How to Trade Forex with COG Trading Indicators and Strategy
 Forex and Stocks “Supply – Demand” Zones Trading Strategy
 5 Minute Chart Surefire RSI-CCI Forex Trading System and Strategy
 Forex & Stocks Auto Stochastic Trend Supply-Demand Trading Strategy & System [9533]
 TOP10 BEST Full Time Forex Trader Trading System and Strategy
