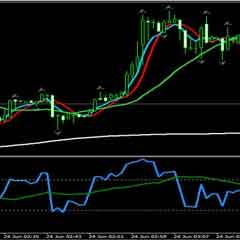
The Best Trading System and Indicator for Scalping on M30. This is actually a manual and should be used as such. It is not a black box system that might work for a while and stop working. Every signal is there on the chart to be seen. We have spent lots of hours visually back testing a bunch of permutations and combinations with some statistical analysis of entry and exit strategies.

Don’t forget that the most important aspect of trading is not actually the strategy, entry or exit rule but who is trading and how disciplined he is in following the set rules. Trading psychology is extremely important.
Keep in mind you need to have the discipline to apply your forex trading strategy if you don’t – then you don’t have one. Trading is all about maintaining rigid discipline and this trait is extremely vital for success.
We took the time to write a very thorough Manual for the Forex Power Trader System because we want everyone who uses it to be successful. Please take the time to study and reference it while you are learning the system. Please remember, you must follow the rules if you want to be a successful trader.
We know the temptation will be there to want to tweak the rules, but please don’t. Follow the plan as it’s laid out here and we are sure over time you’ll be happy with the results. Overcoming your inability to trade the same plan every time you initiate a trade is what stands between you and becoming a successful trader.
Remember, the Forex Power Trader System isn’t the “Holy Grail”. There will be losses, but if you followthe system rules, the losses should be smaller and less often than the winners and you’ll grow your trading account in the long run.
Now, please sit back and make your self comfortable to read and understand every word contained therein and most importantly to do, meaning to apply what was learnt in a disciplined and diligent manner.
The system was designed to run on the M30 timeframe.
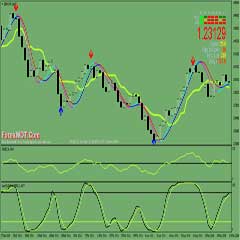
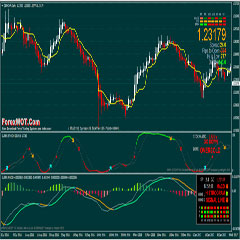
- Up arrow appears on the chart, and
- RSI is above the level 50 line, and
- The black Stoch line has crossed up the lime Stoch line and they are above the level 20 line
- Down arrow appears on the chart, and
- The black Stoch line has crossed down the lime Stoch line and the Stoch lines are falling below the level 80 line
- Down arrow appears on the chart, and
- RSI is below the level 50 line, and
- The black Stoch line has crossed down the lime Stoch line and they are below the level 80 line
- Up arrow appears on the chart, and
- The black Stoch line has crossed up the lime Stoch line and they are moving above the level 20 line
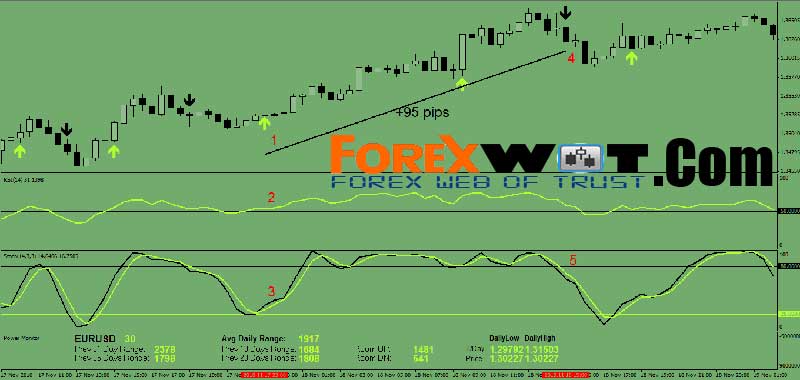
Entry:
- Up arrow appears on the chart, and
- RSI is above the level 50 line, and
- The black Stoch line has crossed up the lime Stoch line and they are above the level 20 line
Exit:
- Down arrow appears on the chart, and
- The black Stoch line has crossed down the lime Stoch line and the Stoch lines are falling below the level 80 line
Profit: + 95 pips

Entry:
- Down arrow appears on the chart, and
- RSI is below the level 50 line, and
- The black Stoch line has crossed down the lime Stoch line and they are below the level 80 line
Exit:
- Up arrow appears on the chart, and
- The black Stoch line has crossed up the lime Stoch line and they are moving above the level 20 line
Profit: + 95 pips
- Up-Down arrows: they indicate possible entry opportunities (with sound and popup message alert). It is recommended to use them only with the combination of RSI and Stoch rules.
- RSI: Developed J. Welles Wilder, the Relative Strength Index (RSI) is a momentum oscillator that measures the speed and change of price movements. RSI oscillates between zero and 100. It is an extremely popular momentum indicator that has been featured in a number of articles, interviews and books over the years.
- Stoch: Developed by George C. Lane in the late 1950s, the Stochastic Oscillator (Stoch) is a momentum indicator that shows the location of the close relative to the high-low range over a set number of periods. It follows the speed or the momentum of price. As such, bullish and bearish divergences in the Stochastic Oscillator can be used to foreshadow reversals. Lane also used this oscillator to identify bull and bear set-ups to anticipate a future reversal. Because the Stochastic Oscillator is range bound, is also useful for identifying overbought and oversold levels.
- Power Monitor: This indicator automatically calculates the currency pair’s average daily range (movement). While not used to determine an entry or exit, this information is important for determining position (lot) size for a trade on the pair. Along with the average daily range, you’ll see a history of the previous 1, 5, 10 and 20 day ranges. The Power Monitor also displays the current daily high and low price of the currency pair and the approximate room for a move up or down in a range.
- Fibonacci: This indicator will automatically plot the current Fibonacci levels for you at the right hand side of the chart. Fibonacci levels are widely used by traders to project where price may move next.
Don’t forget that the most important aspect of trading is not actually the strategy, entry or exit rule but who is trading and how disciplined he is in following the set rules.
Trading psychology is extremely important. Keep in mind you need to have the discipline to apply your forex trading strategy if you don’t – then you don’t have one. Trading is all about maintaining rigid discipline and this trait is extremely vital for success.
Also we would like to suggest that do not put pressures on your trading with daily goals like trying to make 100 pips everyday by forcefully trading. That is not how you do long-term survival business in forex.
Just wait for the right setup whenever it happens and take what the market can easily give you, keep repeating this over and over again till success.
Trading can be boring sometimes particularly when waiting for your trading conditions to be met. Impatience leads to overtrading too.
Risk no more than you can afford to lose. One of the very common reasons why most traders fail is due to over leveraging their accounts. The rule of thumb is to risk only 2% of your account on any single trade.
Example, you have a $3000 dollar account you want to place a trade that ensures that if you were to lose your max loss will be 2% of $3000 which is $60. Which means the amount you are risking for that one trade is only $60 dollars. Then on the upside make sure your risk reward is at least 1:2 meaning for every 1 you lose you gain 2 back in return.
Regardless of the system start with a demo account and paper trade for at least two to three months to really understand how things work.
This is actually a manual and should be used as such. It is not a black box system that might work for a while and stop working. Every signal is there on the chart to be seen. We have spent lots of hours visually back testing a bunch of permutations and combinations with some statistical analysis of entry and exit
strategies.
Read, probably more than once, until you have a clear understanding of the content. The settings you have received have not only being back tested but have been forward tested also and have been found to be very profitable. It is recommended to start with the majors only before adding othercurrency pairs.
There will definitely be losing trades but we base our calculations on monthly totals which we are sure will end up in the positive over a three months period.


