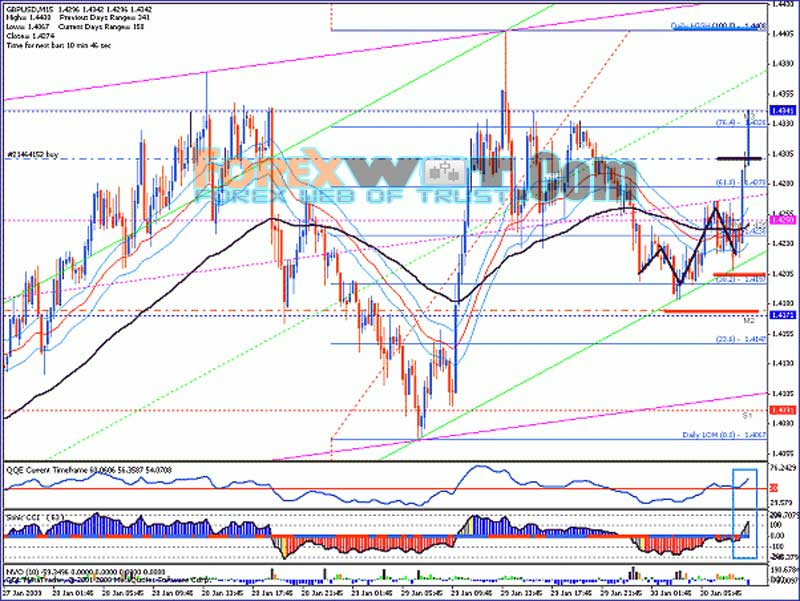
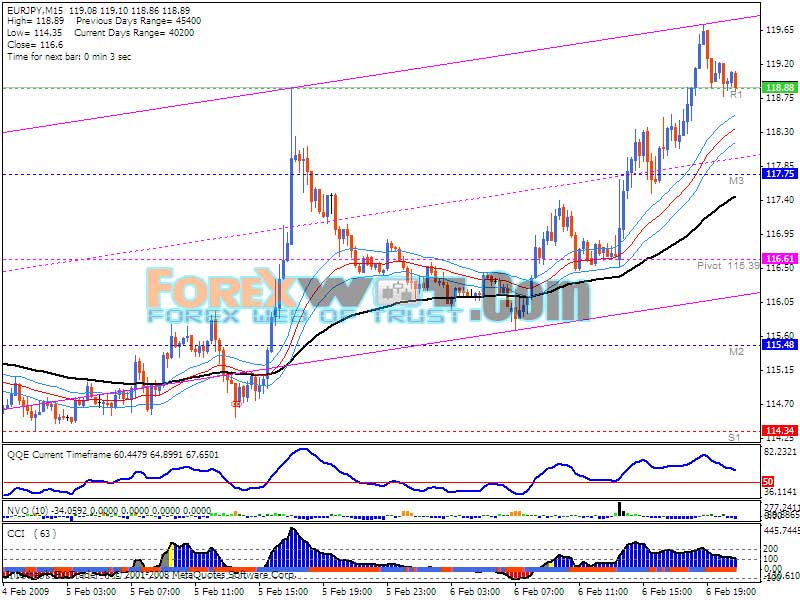
EMA and CCI Forex Indicator and Trading System. First I want to introduce indicators that are used in this trading system. I’ll show you with a picture :
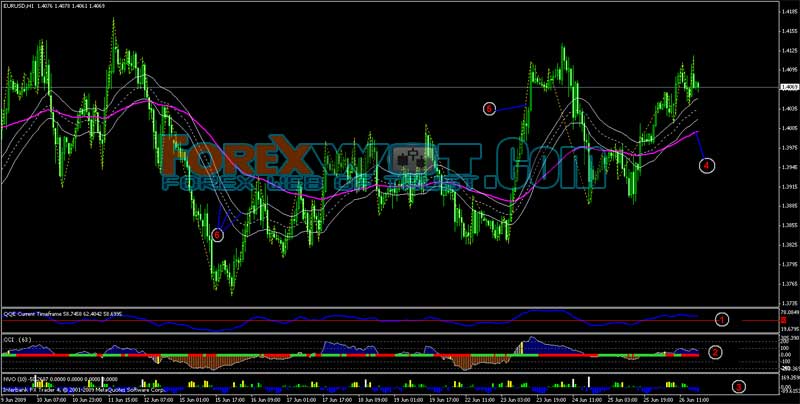
- QQE : It’s an oscillator . It works like RSI or such indicators.
- CCI : It’s and oscillator either and it shows you the direction of the trend. Period sets to 63.
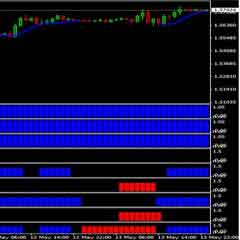
- NVO : Normalized Volume Indicator, it shows you the volume of trades in a certain candle.
- 89 EMA : It’s an Exponential Moving Average with period set to 89.
- ZZ Fractal (Optional) : It helps you see the wave.
- TRO Tunnel Dragon : Sonic call them “Sonic Dragon”. It includes 3 moving averages : the upper one is a 34(period) exponential moving average applied to high ; the middle one is a 34 exponential moving average applied to close; the lower one is a 34 moving average applied to low.
Here is a instruction that how you can read the NVO indicator :
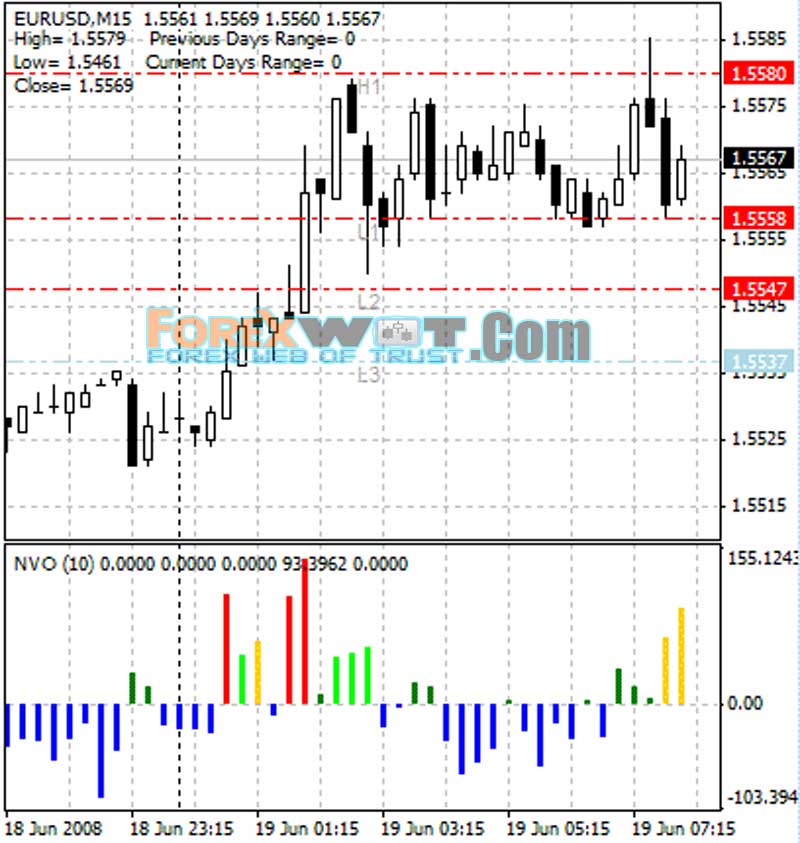
First of all, the normalized values are now expressed in percentage of the average value for a period. Accordingly, the data on the chart can now take negative values, too. This will mean some lull on the market.
Another useful innovation is coloring histogram bars according to the normalized volume size.
- Blue color means that the current volume is less than the average one for this period.
- Dark green color means a small exceeding in volume as compared to the average one for this period.
- Light green color means that the increase in volume has exceeded the Fibo level of 38.2% as compared to the average one for this period.
- Yellow color means that the increase in volume has exceeded the Fibo level of 61.8% as compared to the average one for this period.
- White (it is red in the image below not to melt into the background) color means that the increase in volume has exceeded the Fibo level of 100% as compared to the average one for this period.
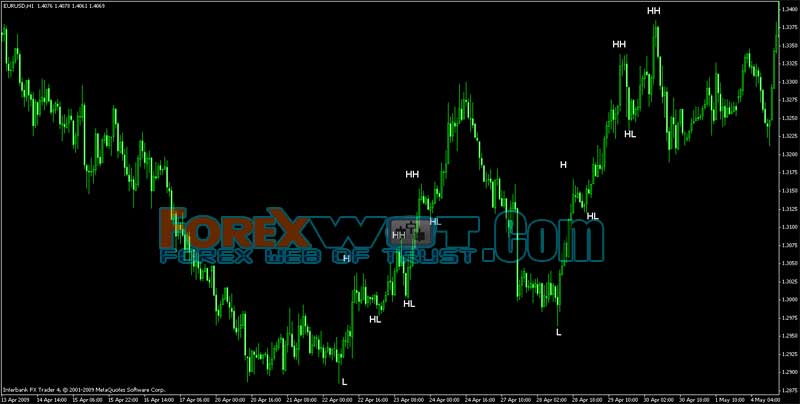
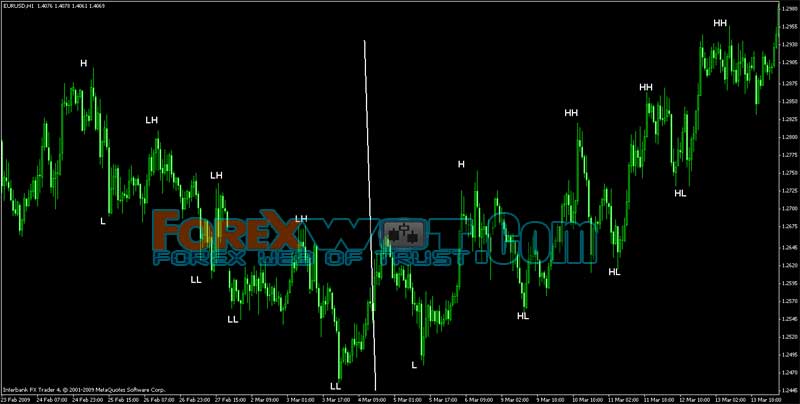
Before we go to entry setups, let me tell you that the most important method that is used in this system is wave analysis. For you to understand it better, I’m going to show you some examples. It’s better that you study more about waves by yourself.
There are some words in the examples, here are the meanings :
- L = Low ; H = High
- LL = Lower Low ; HH = Higher High
- LH = Lower High ; HL = Higher Low
You can see serials of Higher High (HH) and Higher Low (HL) in a uptrend while Lower High(LH) and Lower Low(LL) in a downtrend.
Example #1:
Example #2 :
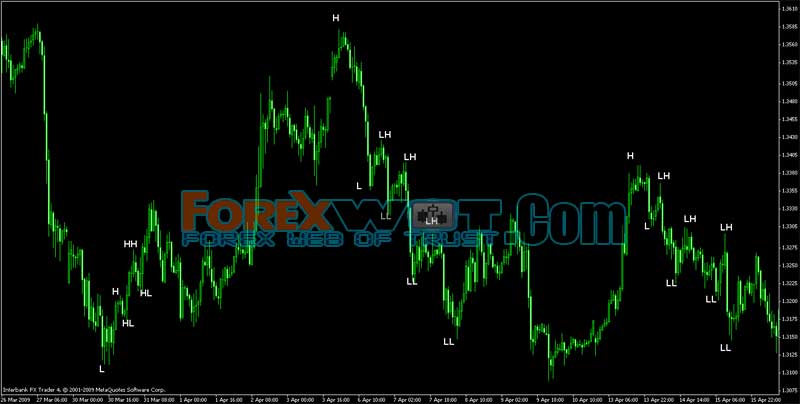
Example #3 :
- 1 a.m. – 4 a.m. EST (UK session)
- 7 a.m. – 11 a.m. EST (US session)
This is the recommended trading time, they are in EST, so that plz adapt to your time zone accordingly.
You can use it in any pair. Try EUR/USD & GBP/USD or if you choose XXX/JPY pairs, change your trail stop and stoploss at least 80 pips.
M5 & M15 (Recommended)
This strategy is based on wave analysis. So it’s important that you have a good understanding of waves. First you should see a LOW in the price , then price should make HIGHER LOWs (HL).
Like the example below, after making a HIGHER LOW, look for the candle go above upper white line (upper band of tunnel dragon indicator) and wait till the candle closes. Then put a buy stop few pips above the high of that candle.
- QQE must be above the 50 Line and sloping up.
- CCI must be above the zero line and sloping up. It’s better that the colour of middle line of the CCI indicator be green for a long entry.
- It’s better and safer if there is a volume charge in NVO indicator.
- Pay attention to the angle of the slope on Tunnel Dragon (or three 34 MAs). The steeper, the better. Avoid horizontal ranging periods. (Direction of angle : Long 1 to 2 O’clock, Short 4 to 5 O’clock, avoid 3 O’clock ranging)
- Have general trend/bias in mind, you can check it in higher time frames like H1, H4 and daily.
- It’s better that price be above the 89 EMA for a long entry.
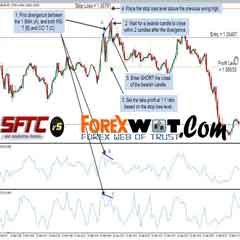
- Lookout for divergence. You can check it out in QQE or CCI indicator either.
For long, few pips below the lower white line (lower line of tunnel dragon indicator) or nearest support or min 40 pips. It’s more conservative if you put your stop loss lower than the HIGHER LOW (in wave analysis).
You can use PPZ (Pivot Point Zones) or resistance or round numbers for take your profit. Or you can put it below the lower white line (tunnel dragon indicator) when the price touches the lines again Or you can use Trailing Stop (For example you can trail it for 40 pips).
- For Sell Entry it’s Vice Versa
In next pages I brought some examples of both short entries and long entries so you could understand it better. More examples are in the threat.
Example #1:

Example #2:


Example #3:

This system will give you winning trades most of the time, if you follow the rules.
It is not the magic bullet, nothing is. Whenever you trade always have a SL set, take it with pride when the trade turn out to be a loser.
This system is an edge for you trading career and you can profit consistently.


