High accuracy “RSI OverBought OverSold Trading” – In terms of market analysis and trading signals, RSI moving above the horizontal 30 reference level is viewed as a bullish indicator, while the RSI moving below the horizontal 70 reference level is seen to be a bearish indicator.

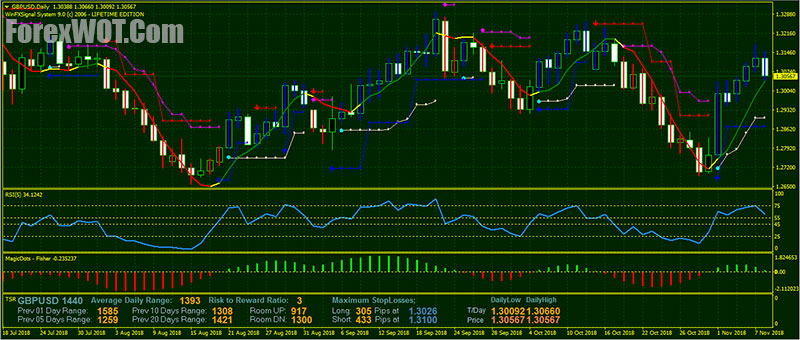
Since some assets are more volatile and move quicker than others, 80 and 20 are also frequently used overbought and oversold levels.
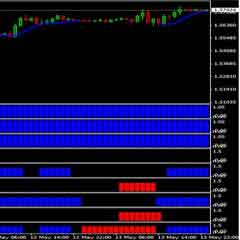
But in this 5RSI we use 75 as overbought level and 35 as oversold level.
MetaTrader Trading Indicators
- RSI
- Fisher Yur4ik
- Brain Trend indicators
- LSMA in color
BUY Rules
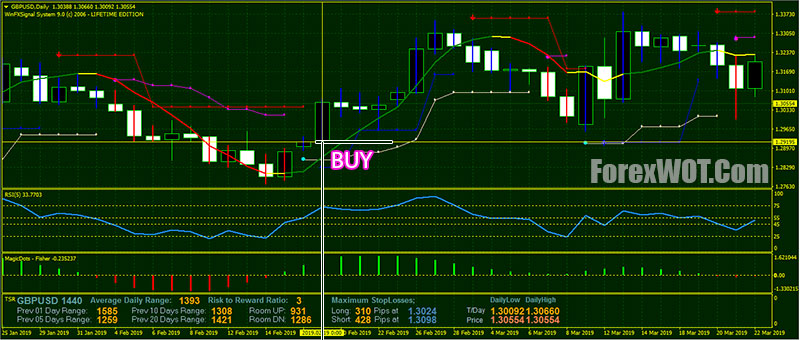
- RSI:
- Upward from oversold area
- Above level 55 line
- Fisher Yur4ik: Lime histogram
- Brain Trend indicators: Bullish
- LSMA in color: Green line
SELL Rules
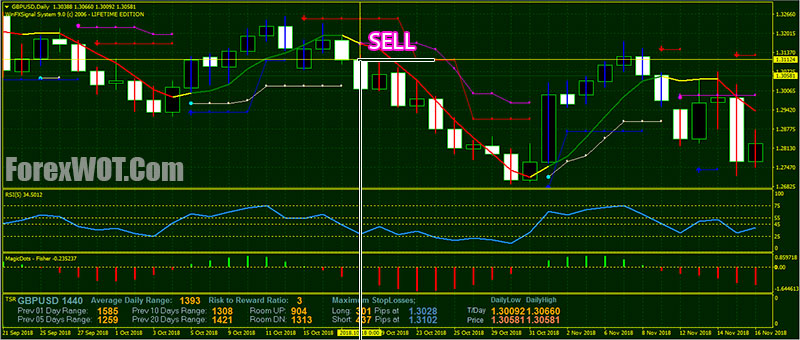
- RSI:
- Downward from overbought area
- Below level 45 line
- Fisher Yur4ik: red histogram
- Brain Trend indicators: Bearish
- LSMA in color: Red line
 20 Halloween Costumes From Amazon All Traders will Actually Want To Wear
 2 MACD Effortless Forex & Stocks Swing Trading Strategy
 FREE DOWNLOAD 20+ Best Forex MACD-Moving Average Trading System
 MA COBRA Forex & Stocks Trading Strategy (Extremely Low Risk High Reward Trading Strategy) (COBRA SYSTEM)
 Foreign Exchange Trading : Online Forex Master Level Trading System and Strategy
 Forex & Stocks Trading Strategy with EMA-MACD Trend Dominator System
 TOP10 BEST Full Time Forex Trader Trading System and Strategy
 High Profits and Super Effective FCP Forex Trading System (Forex Secret Protocol)
 TOP 10 Best Bollinger Bands Forex Trading System and Strategy
 A Complete Trading System Used by Professionals to Make Millions
