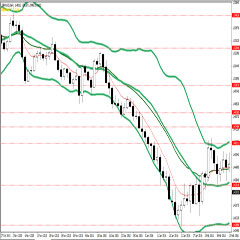
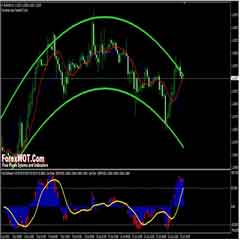
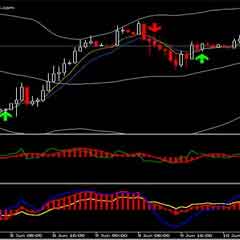
High accuracy “RSI OverSold OverBought Trading With Bollinger Bands Filter” – Unlike price action trading system, RSI and Bollinger Bands Oversold/OverBought system is a bit more measurable.
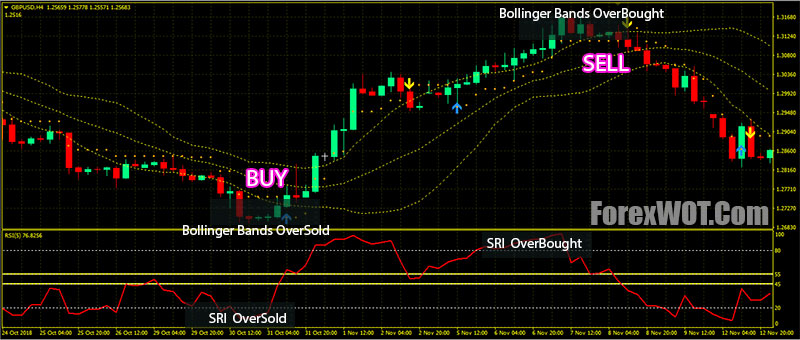
This strategy is an excellent strategy that allows a trader to squeeze out big pips with very minimal risk. This allows traders to get trades with great reward-risk ratios.
- Time Frame: H4
- Currency Pairs: Any
- Relative Strength Index
- Bollinger Bands
- Stop Reversal
Unlike price action, technical indicators are a bit more measurable. This is because technical indicators are mathematically derived figures plotted or drawn based on historical price data.
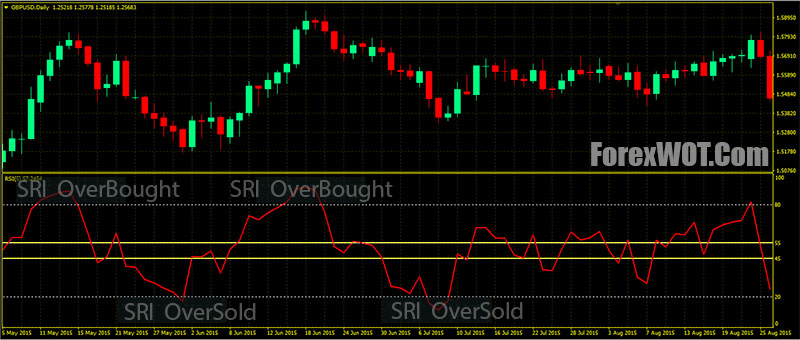
RSI (Relative Strength Index) is one of the most widely used oscillators.
Most oscillators including RSI work with so-called overbought and oversold areas. The market is overbought when there has been “too much” buying in the recent past (last few price bars).
Conversely, an oversold market occurs when sellers have prevailed and pushed the price down.
Another indicator that has caught the minds of many traders are indicators that have some sort of upper and lower bands, like the Bollinger Bands.
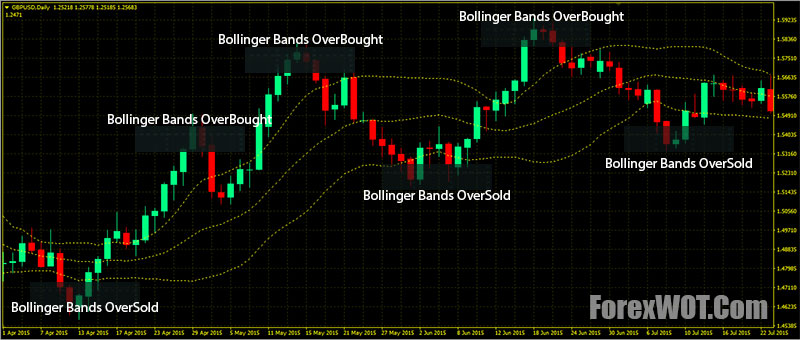
These upper and lower bands act as a marker to identify overbought or oversold price conditions, which could eventually result in a reversal.
- Download “ForexWOT.Com-RSIOverBoughtOverSoldSystem” (Zip/RAR File).
- Copy mq4 and ex4 files to your Metatrader Directory …/experts/indicators/
- Copy the “ForexWOT.Com-RSIOverBoughtOverSoldSystem.tpl” file (template) to your Metatrader Directory …/templates /
- Start or restart your Metatrader Client.
- Select Chart and Timeframe where you want to test your forex system.
- Right click on your trading chart and hover on “Template”.
- Move right to select “ForexWOT.Com-RSIOverBoughtOverSoldSystem” trading system and strategy
- You will see “RSI OverSold OverBought “Stop Reversal” Trading System” is available on your Chart
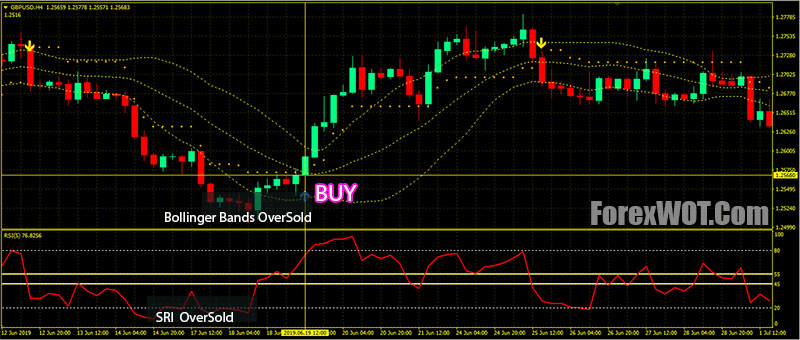
- Relative Strength Index: Price should have touched or is below the OverSold area (below level 20)
- Bollinger Bands: Price should have touched or is below the lower outer band
- Stop Reversal: A blue arrow pointing up should appear
- Enter a BUY market order:
- at the close of the candle with a confluence of these rules
- RSI line upward and above level 55 line
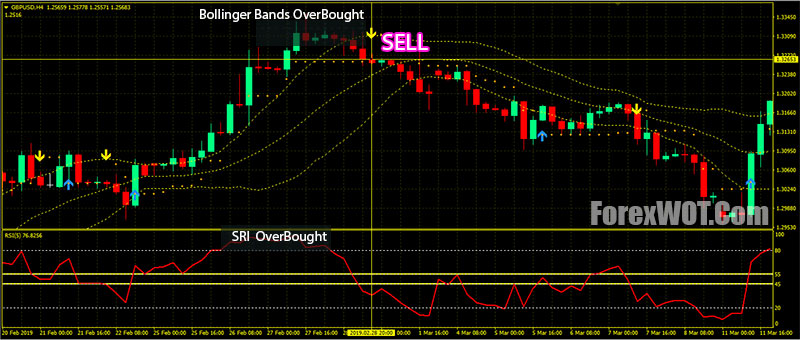
- Relative Strength Index: Price should have touched or is above the Overbought area (above level 80)
- Bollinger Bands: Price should have touched or is above the upper outer band
- Stop Reversal: A yellow arrow pointing down should appear
- Enter a BUY market order:
- at the close of the candle with a confluence of these rules
- RSI line downward and below level 45 line
This strategy is an excellent strategy that allows a trader to squeeze out big pips with very minimal risk. This allows traders to get trades with great reward-risk ratios.


