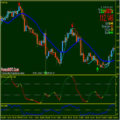
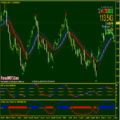
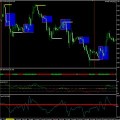
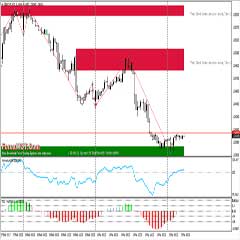
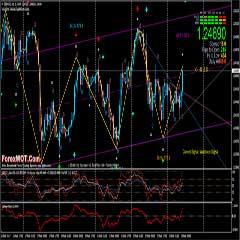
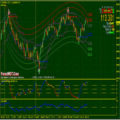
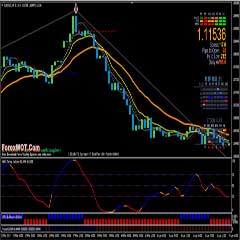
High accuracy, simple and profitable Forex ZigZag BreakOut trading strategy. This Zigzag Indicator repaint..?
Short answer: yes.
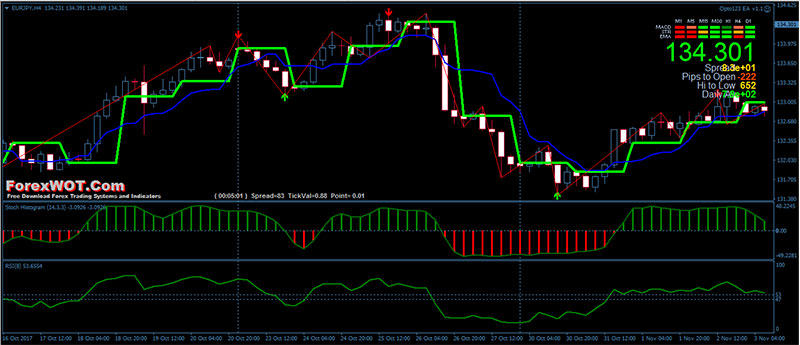
But, it only repaints if a swing high/swing low point has not been completed yet.
Once completed, it can’t repaint as now a new swing high/swing low is next to be formed and that’s the only thing that makes it repaint (when a new swing high or swing low is not yet established, the zigzag indicator will repaint).
The Zig-Zag indicator attempts to determine price trends, support and resistance areas, and classic chart patterns like head and shoulders, double bottoms and double tops.
The Zig-Zag indicators use both swing highs and swing lows in its calculation:
- Swing Highs: When a price (usually close) is both higher than the price previous to it and after it.
- Swing Lows: When a price is both lower than the price prior to it and lower than the price following it.
The ZigZag is a very basic indicator which attempts to reduce the amount of “noise” in a trending market.
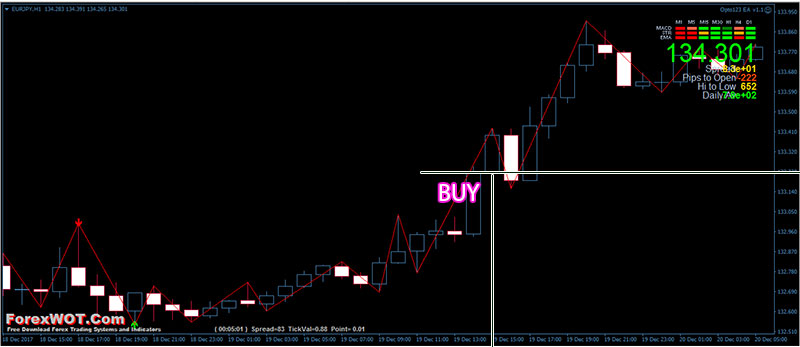
The aim of the ZigZag indicator is to assist traders with staying in a winning position and avoid the urge to close positions on the minor reactions, which are commonplace in the market.
On first glance, the ZigZag appears to be the HOLY GRAIL of trading, but you have to remember that the values are plotted after the price closes.
So, you will want to use the indicator to monitor the health of the primary trend and not a tool for actively trading the market.
One thing you must be aware of this “Profitable Forex ZigZag BreakOut Trading Strategy” is on the current wave the ZigZag can change but the past ZigZag waves are locked in place and it’s these we use.
- Best TimeFrames: M15, M30, H1, H4, and Daily
- Most Recommended Currency Pairs: BitCoin, EURUSD, GBPUSD
- ZigZag
- Daily Open
- Kijun-Sen Ichimoku Kinko Hyo
- Signal Trend
- StochHistogram
- Relative Strength IndexMetaTrader Trading Indicators
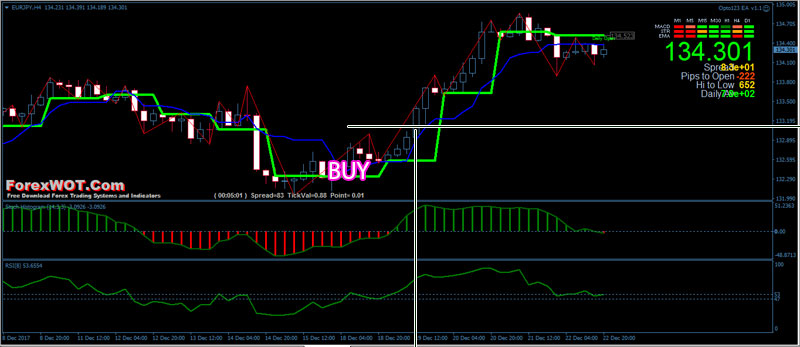
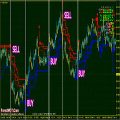
- Price upward above the previous ZigZag swing high and Daily Open line
- Kijun-Sen line upward
- Signal Trend green color bars
- StochHistogram green color
- Relative Strength Index line upward and above 50 level
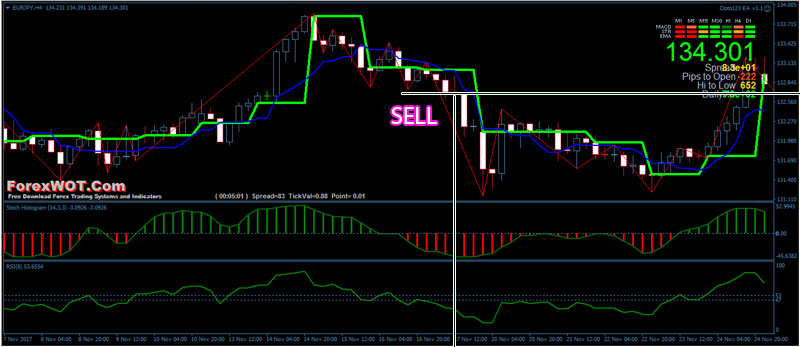
- Price downward below the previous ZigZag swing low and Daily Open line
- Kijun-Sen line downward
- Signal Trend red color bars
- StochHistogram red color
- Relative Strength Index line downward and below 50 level
Many a novice trader looks at this indicator and wonder if this is THE HOLY GRAIL.
The highs and lows in the perfect are 100% accurately depicted in the graph.
Before you get too excited, the ZigZag cannot predict the highs and lows in advance. Nothing about this indicator makes predictions.
In fact, this indicator REPAINTS.
Do you see this high here on the chart? Well, the ZigZag started drawing the high here. Then, when this high was made, it deleted that point and said, “Oh no, no.” The new high is here. Every time the market makes a new high, the ZigZag deletes its last drawing and replaces it with the higher high.
Again, I’m only saying this to highlight that the indicator does not make predictions.
The power of this tool is that it CONSISTENTLY draws historical HIGHS and LOWS in the same way.


