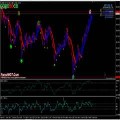
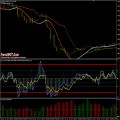
The best signal offered by the CCI indicator trading system – Forex Commodity Channel Index (CCI) Indicator Trading ystem With TDI RSI Signal Line. CCI measures the statistical variation from the average. It is an unbounded oscillator that generally fluctuates between +100 and -100. Traders use the CCI in a variety of ways. Three common uses are:

- CCI in retracements
- CCI on breakouts
- CCI in divergent trades
This Forex Commodity Channel Index (CCI) Indicator Trading ystem With TDI RSI Signal Line will be the first of three regarding common uses of CCI and will focus on how to use this oscillator in retracements.
Approximately 70-80% of the values tend to fall inside the +100 to -100 range. Above the +100 value is considered overbought while below the -100 value is considered oversold.
As with other overbought/oversold indicators, this means that there is a large probability that the price will correct to more representative levels. Therefore, if values stretch outside of the above range, a retracement trader will wait for the cross back inside the range before initiating a position.
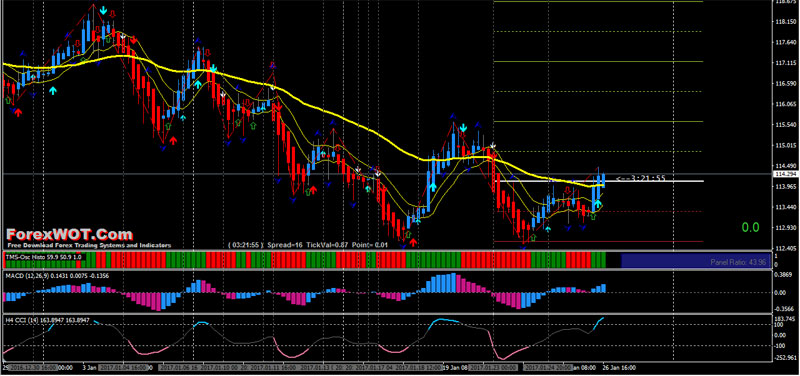
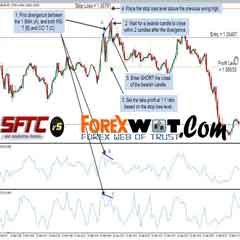
CCI Retracements Trading System & Rules
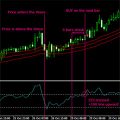
First identify the direction of the prevailing trend. If you are trading off of a 4 hour chart, determine the direction of the daily trend. If you are trading off a 15 minute chart, determine the direction of a trend on the 2 hr chart.
BUY Rules

- If the trend is up (BUY), wait for the CCI to move below -100 (oversold territory) and cross back above -100 to create a buy signal. Place your stop loss just below the swing low. Look to take profits at least twice the distance to your stop loss so you are maintaining at least a 1: 2 risk to reward ratio.
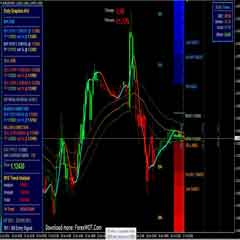
- MACD histogram bue andabove 0 line
- TMS-Osc Histo green
- Price Above APB indicator
- PAPB indicator upward and above EMA 50.
SELL Rules
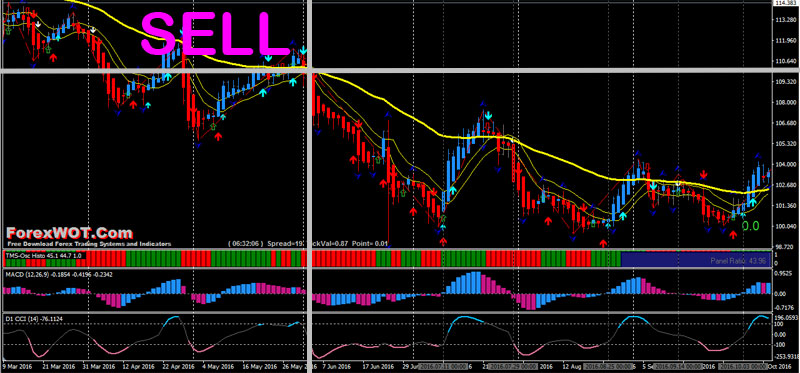
- If the trend is down (SELL), wait for the CCI to move above the +100 (overbought territory) and cross back below +100 to create a sell signal. Place your stop loss just below the swing high. Look to take profits at least twice the distance to your stop loss so you are maintaining at least a 1: 2 risk to reward ratio.
- MACD histogram red and below 0 line
- TMS-Osc Histo red
- Price below APB indicator
- PAPB indicator downward and below EMA 50.
The Commodity Channel Index is an extremely useful tool for traders to determine cyclical buying and selling points. Traders can utilize this tool most effectively by (a) calculating an exact time interval and (b) using it in conjunction with several other forms of technical.
 Forex and Crypto “MORNING TRADE” Trading Strategy for Advanced Traders
 Foreign Exchange Currency Trading & Investment Strategy – Forex Z 20 System for Successful and Highly Profitable Forex Trader
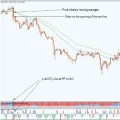
 Forex Breakout Trading Strategy with CCI and ADX
 Foreign Exchange Currency Trading – Double CCI Retracement Forex Trading Method with Heiken Ashi Smoothed (HA)
 Forex Magic Breakout EMA CCI Trading – Maximize Your Profits and Achieve Exponential Earnings
 5 Minute Chart Surefire RSI-CCI Forex Trading System and Strategy
 Best Forex & Stocks Trading Strategy with Dolly-Graphics System
 Forex Technical Analysis – RSI CCI Forex Trend Trading System and Strategy
 BullPips and The Twin EMA Forex Strategy For Effective Trend Trading
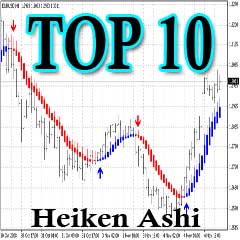 Top 10 Super Effective High Profits Forex Heiken Ashi Trading System and Strategy
