Forex H1 Williams Percent Range Trading Strategy – In technical analysis, this is a momentum trading system measuring overbought and oversold levels, similar to a stochastic oscillator. Williams %R was developed by Larry Williams and compares a stock’s close to the high-low range over a certain period of time, usually 14 days.

Williams %R is used to determine market entry and exit points. The Williams %R produces values from 0 to -100, a reading over 80 usually indicates a stock is oversold, while readings below 20 suggests a stock is overbought.

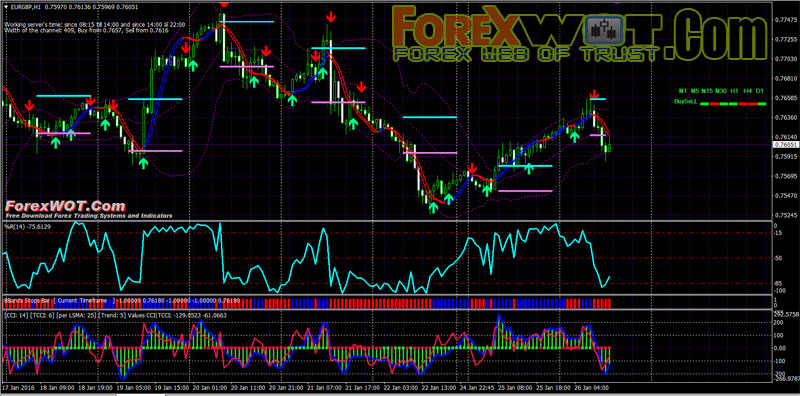
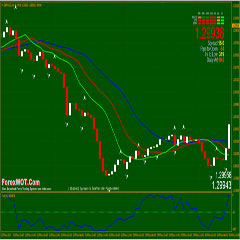
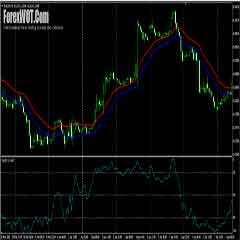
The Williams Percent Range indicator is composed of a single fluctuating curve. Traders will occasionally add a Smoothed Moving Average, as above in “Red”, to enhance the value of the trading signals. In the example above, the “Blue” line is the Williams Percent Range, while the “Red” line represents a “SMA” for “14” periods.
The Williams Percent Range is viewed as a “leading” indicator, in that its signals foretell that a change in trend is imminent. The weakness in the indicator is that timing is not necessarily a product of the %R oscillator, the reason for attaching a “lagging” moving average to confirm the Williams Percent Range signal.
Forex traders favor the Williams Percent Range indicator because of its ability to foretell reversals one to two periods ahead of time. As with any oscillator, one should wait until actual pricing behavior confirms the reversal.
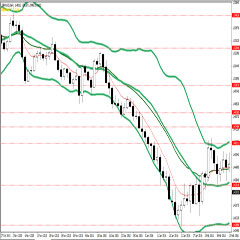
Forex Williams Percent Range Trading Strategy with Bollinger Band Stops Bars and TriggerLines Indicator is a intraday trading system based on Williams Percent Range and Maksigen indicator filtered by Bollinger Band Stops Bars and TriggerLines Indicator.
Best Time Frame : 60 minutes or H1.
Currency pairs : Major.
Metatrader indicators:
- Moving Average,
- Triggerlines indicator,
- Daily Smart alerts,
- Bollinger bands (20:2),
- Maksigen channel (in this scalping system draw two lines from 8:00 to, 22:00 GMT)
- SMA-Crossover signal (faste ma 2 period- slow ma 5 period) optional,
- Williams s Percent Range indicator,
- Bollinger Band Stops Bars,
- Double CCI14 (optional)
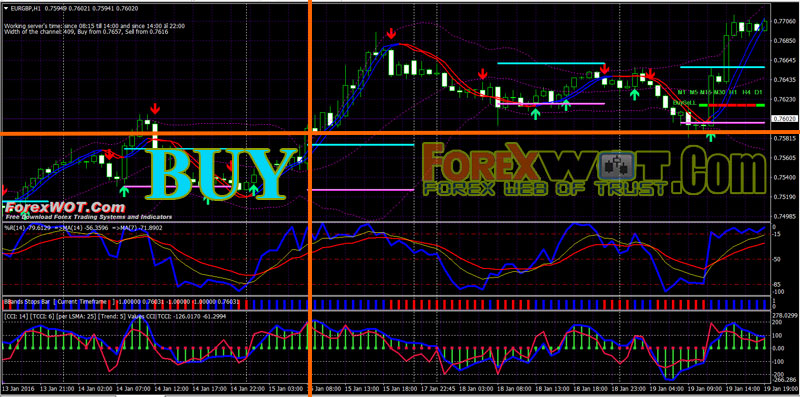
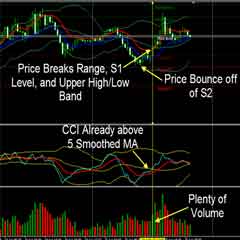
Rules for Forex Williams Percent Range Trading Strategy with Bollinger Band Stops Bars and TriggerLines Indicator.
- When the price breaks upper line of Maksigen,(place a pending order 3 pips above upper line) buy if:
Triggerline indicator is blue; - Williams s Percent Range indicator > 85;
- Yellow EMA 7 cross above red EMA 14;
- Bollinger Band Stops Bars has blue bars;
- CCI line red is > CCI line blue. (optional)
Re-entry, if you do no exit position at end of the day, when triggre line turns blue.
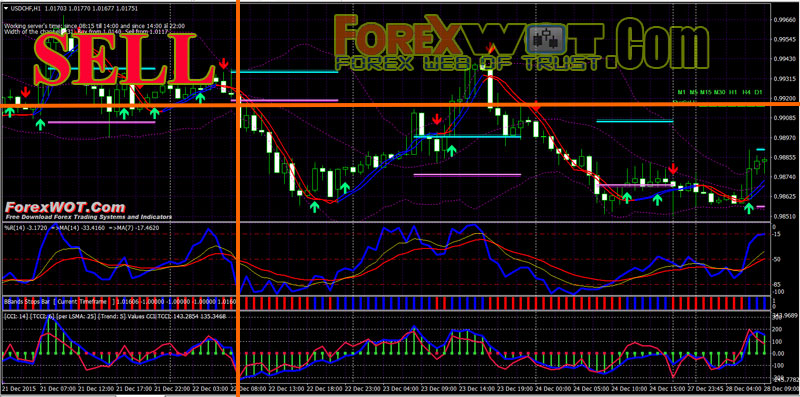
- When the price breaks lower line of Maksigen, (Place a pending order 3 pips below lower line) sell if:
- Triggerline indicator is red;
- Williams s Percent Range indicator < 15;
- Yellow EMA 7 cross below red EMA 14;
- Bollinger Band Stops Bars has red bars;
- CCI line red is < CCI line blue (optional)
Re-entry, if you do no exit position at the end of the day, when triggreline turns red.
- end of the day (24:00 GMT),
- when triggeline chenge color,
- with profit targe predetermined 12-20 pips depends by Currecy pairs.
William % R Note:
Importantly, if an overbought/oversold indicator, such as Stochastics or Williams %R, shows an overbought level, the best action is to wait for the futures contract’s price to turn down before selling.
Selling just because the contract seems to be overbought (or buying just because it is oversold) may take a trader out of the particular market long before the price falls (or rises).
 TOP 10 Best Bollinger Bands Forex Trading System and Strategy
 FREE DOWNLOAD Top 10 Forex Currency Trading Systems With Bollinger Bands Indicator
 How To Trade High Accuracy Bill Williams Fractals Alligator Trading System
 Best Momentum Indicators Forex Technical Analysis & Trading System
 Forex Day Trading – Secrets Bollinger Bands Forex Trading System Reveal
 2 MACD Effortless Forex & Stocks Swing Trading Strategy
 Forex Profit Fusion – Learn How To Profit Foreign Exchange Markets in 30 Minute Time Frame
 FREE DOWNLOAD 20+ Best Forex MACD-Moving Average Trading System
 Advanced Moving Average Forex Trading Tutorial – How To Become A Successful Forex Trader With Moving Average Indicator
 Forex & Stocks Multi Bollinger Bands Price Action Trading Strategy [8858]
