High accuracy Vortex Trend Retracement Trading System and Strategy. These strategies are popular because they enable you to trade with the trend.
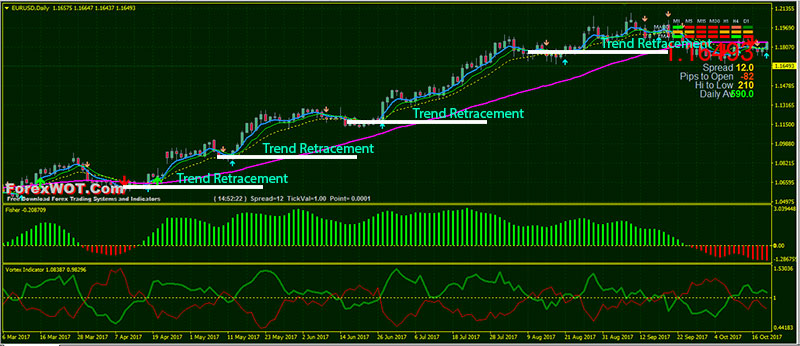
But, the main difficulty you will have is how to determine whether a price is performing a retracement or a major reversal.
Professional traders love retracements.
When a trend retraces, it offers a potential low-risk/high-reward entry into the market.
A trader looking for retracement opportunities has one question on their minds.
How much does the trend need to retrace…?
This is a tough question.
Shallow retracements often fail, except in the strongest trends. Deep retracements might be a reversal signal in disguise.
Both scenarios are tricky.
The Vortex Indicator helps isolate trends, which can aid new traders in determining whether a price is performing a RETRACEMENT or a major REVERSAL.
The Vortex Indicator is composed of two lines–typically colored GREEN and RED, and labeled VI+ and VI-, representing up moves versus down moves.

When the red line crosses above the green line it indicates a downtrend could be beginning on the timeframe being watched. As long as the red line stays above the green line, the downtrend is in effect.
When the green line crosses-above the red line it indicates an uptrend could be beginning. As long as the green line stays above the red line, the uptrend is in effect.
There are various practical methods to deal with this question of TREND RETRACEMENT.
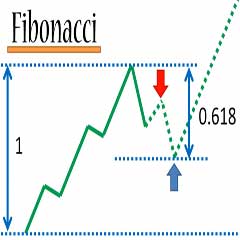
Some traders look for retracements to moving averages like in the 5/8/21/50 trading strategy. Others look for Fibonacci retracements based on a percentage of a prior swing.
Among the retracement swing trading strategies, Vortex Trend Retracement System is a particularly reliable and effective method.
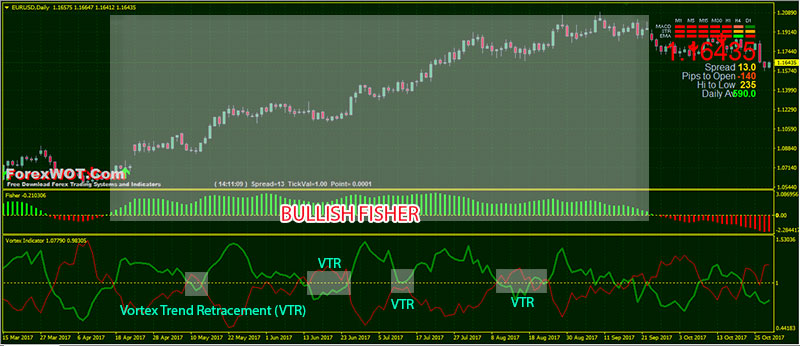
This is how I use Vortex Trend Retracement System.
- Best Time Frames: H1, H4, and Daily
- Recommended Currency Pairs: Bitcoin, EURUSD, and GBPUSD
- Vortex
- Fisher
- Moving Average
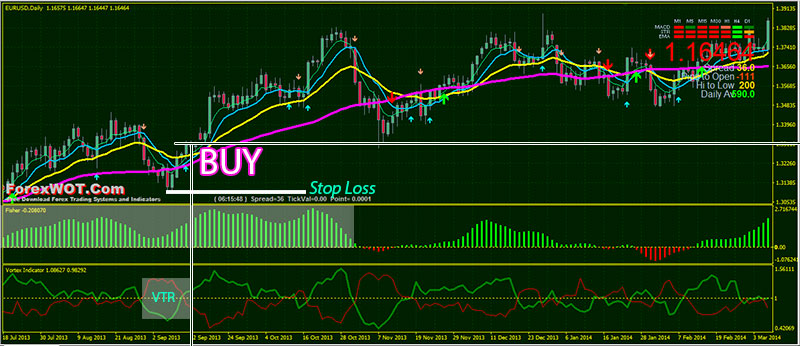
- Market is uptrend
- (Price upward and above 50 SMA)
- Fisher indicator green color
- Green Vortex line crosses above the red line
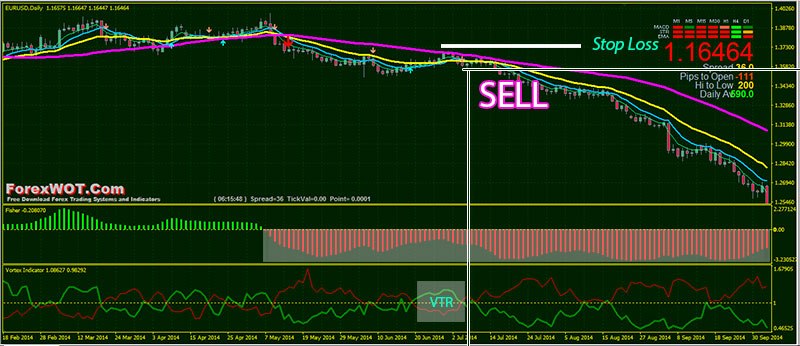
- Market is downtrend
- (Price downward and below 50 SMA)
- Fisher indicator red color
- Green Vortex line crosses below the red line
Market Reversals And How To Spot Them
A reversal is a change in the direction of a price trend, which can be a positive or negative change against the prevailing trend.
On a price chart, reversals undergo a recognizable change in the price structure.
A reversal is also referred to as a “TREND REVERSAL,” a “rally” or a “correction.”
- An uptrend, which is a series of higher highs and higher lows, reverses into a downtrend by changing to a series of lower highs and lower lows.
- A downtrend, which is a series of lower highs and lower lows, reverses into an uptrend by changing to a series of higher highs and higher lows.
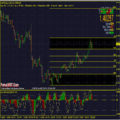
Take a look at the image below.
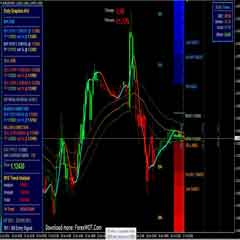
This is how I use Vortex Trend Retracement System to spot TREND REVERSAL.
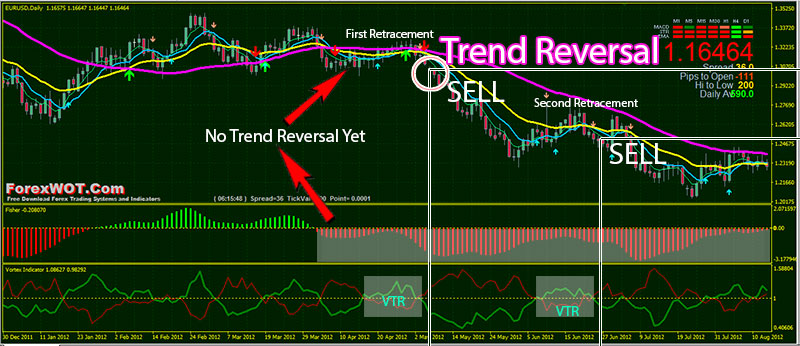
With this Vortex Trend Retracement System, it’s possible for you to distinguish retracements and reversals as they are happening.
You will not be right 100% of the time but you can get it right more often than not.




The system u mentioned on your webpage is repainting or non-repainting?