DOWNLOAD High Profits Forex Technical Analysis -Forex Bollinger Bands Momentum ADX Technical Analysis Trading. Technical analysis is a trading tool employed to evaluate securities and attempt to forecast their future movement by analyzing statistics gathered from trading activity, such as price movement and volume.

Unlike fundamental analysts who attempt to evaluate a security’s intrinsic value, technical analysts focus on charts of price movement and various analytical tools to evaluate a security’s strength or weakness and forecast future price changes.
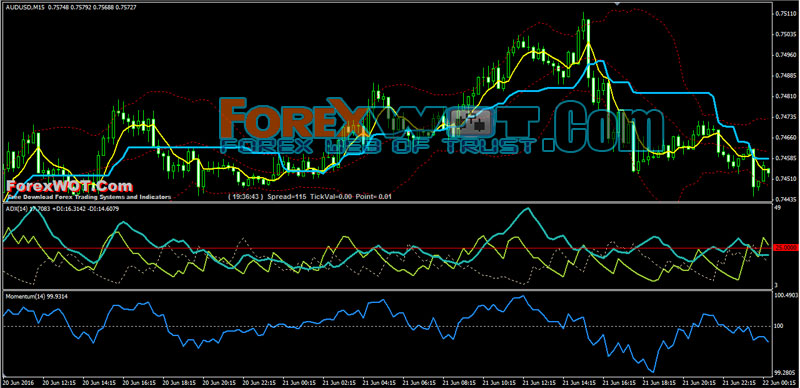
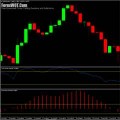
This is a Forex Technical Trading System based on the Bollinger Bands, momentum, and ADX.
Bollinger Bands® are one of the most popular technical indicators for traders in any financial market, whether investors are trading stocks, bonds or foreign exchange (FX).
Many traders use Bollinger Bands® to determine overbought and oversold levels, selling when price touches the upper Bollinger Band® and buying when it hits the lower Bollinger Band®.
In range-bound markets, this technique works well, as prices travel between the two bands like balls bouncing off the walls of a racquetball court. However, Bollinger Bands® don’t always give accurate buy and sell signals.
Momentum is perhaps the simplest and easiest oscillator to understand and use; it is the measurement of the speed or velocity of price changes. In “Technical Analysis of the Financial Markets”, John J. Murphy explains:
“Market momentum is measured by continually taking price differences for a fixed time interval. To construct a 10-day momentum line, simply subtract the closing price 10 days ago from the last closing price. This positive or negative value is then plotted around a zero line. The formula for momentum is:
M = V – Vx
Where V is the latest price, Vx is the closing price x number of days ago (number of period).”
ADX is used to quantify trend strength. ADX calculations are based on a moving average of price range expansion over a given period of time. The default setting is 14 bars, although other time periods can be used. ADX can be used on any trading vehicle such as stocks, mutual funds, exchange-traded funds and futures.
- Pairs: Major
- Best Time frame: 15M or H1
- Spread max:0,0001.
Indicators:
- Bollinger bands (20, 2);
- ADX (14 period);
- Momentum (14 period );
- Kinjun-Sen +

- Price upward move above the middle band Bollinger Bands ( deviation 2 and 20 period);
- ADX>25 at the same time;
- Momentum upward move above 100 line;
- EMA 5 open above kinjun-sen + (candles upward above EMA 5 open)
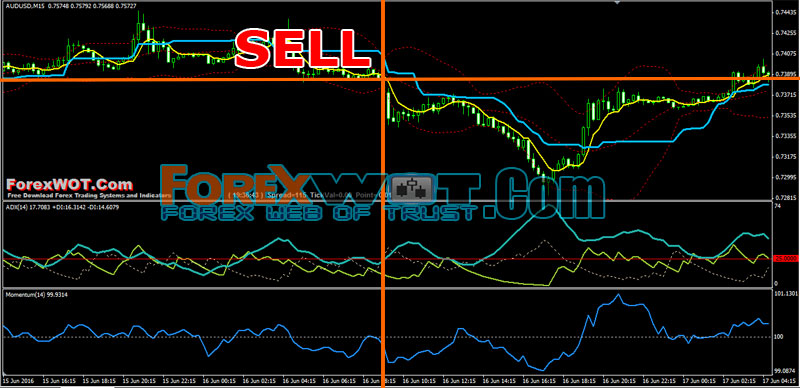
- Price downward move below the middle band Bollinger Bands ( deviation 2 and 20 period);
- ADX>25 at the same time;
- Momentum downward move below 100 line;
- EMA 5 open below kinjun-sen + (candles downward below EMA 5 open)
Do not scalp 30 minutes before a orange or red news report and not for a hour afterwards.
 20 Halloween Costumes From Amazon All Traders will Actually Want To Wear
 2 MACD Effortless Forex & Stocks Swing Trading Strategy
 MA COBRA Forex & Stocks Trading Strategy (Extremely Low Risk High Reward Trading Strategy) (COBRA SYSTEM)
 FREE DOWNLOAD 20+ Best Forex MACD-Moving Average Trading System
 Advanced Moving Average Forex Trading Tutorial – How To Become A Successful Forex Trader With Moving Average Indicator
 Foreign Exchange Trading : Online Forex Master Level Trading System and Strategy
 Top 10 Forex ADX Trading System (High Accuracy ADX System)
 Forex and Crypto “MORNING TRADE” Trading Strategy for Advanced Traders
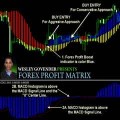 Forex Profit Booster Trading Strategy – Most of The Time it Doesn’t Give False Signals
 FOREX 1 MIN Scalping Trading Tricks By The Most Successful Forex Trader
