Super Easy Forex Trend Momentum Trading with Brooky Support Resistance – Support and resistance are one of the most widely used concepts in Forex trading.

From a strategic point of view, support and resistance levels represent smart places to anticipate a reaction in the price of an asset and therefore represent a basic tool in technical analysis.
Don’t be disappointed if S&R lines haven’t worked for you until now.
You see, in reality, support and resistance are price zones, not exact numbers.
If the market were made by S&R lines and not by people, then the exchange rate would always rise and fall to the same exact price points, over and over again.
But because that rarely happens it’s important to think of support and resistance as zones on the chart where people buy and sell.
Brooky Support Resistance indicator (Brooky KST Advanced Analysis V3 Chart) is a good tool to determine support and resistance areas.
When plotting support and resistance, you don’t want the reflexes of the market.
You only want to plot its intentional movements.
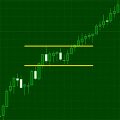
Look at the chart below.
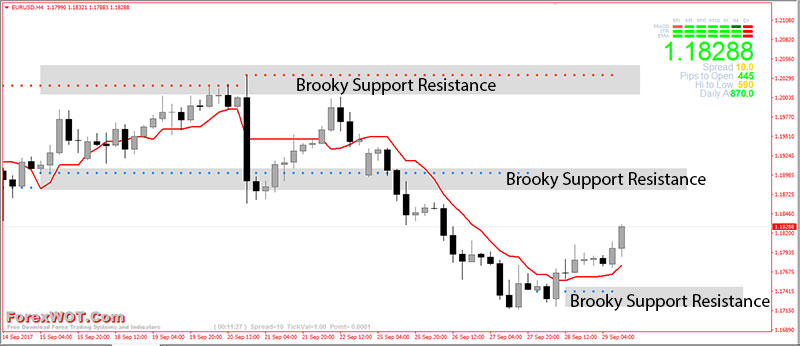
With a little practice, you’ll be able to spot potential forex support and resistance areas easily.
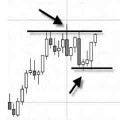
- When the price passes through a resistance, that resistance could potentially become support.
- The more often price tests a level of resistance or support without breaking it, the stronger the area of resistance or support is.
- When a support or resistance level breaks, the strength of the follow-through move depends on how strongly the broken support or resistance had been holding.
One of the key concepts in technical analysis is the idea of the TREND.
Many strategies rely on identifying whether the market is a trend or not — and from there, working out if a trend is beginning or coming to an end.
Knowing whether a trend is starting up or just about to break down is an extremely useful piece of information to have at your disposal.
Part of knowing whether a trend will continue comes down to judging just how much gusto lies behind the move.
This strength behind the trend is often referred to as MOMENTUM, and there are a number of indicators that attempt to measure it.
What are the best TREND MOMENTUM indicators for the stock market and forex market?
Some of the better-known momentum indicators are Relative Strength Index (RSI), Stochastic and Moving Average Convergence Divergence (MACD).
But in this trading system, we use Relative Strength Index (RSI) and some easy high accuracy custom indicators.
The calculation of the momentum indicators is fairly straightforward.
The indicator works by making a comparison between a certain price and the price a set number of periods before that.
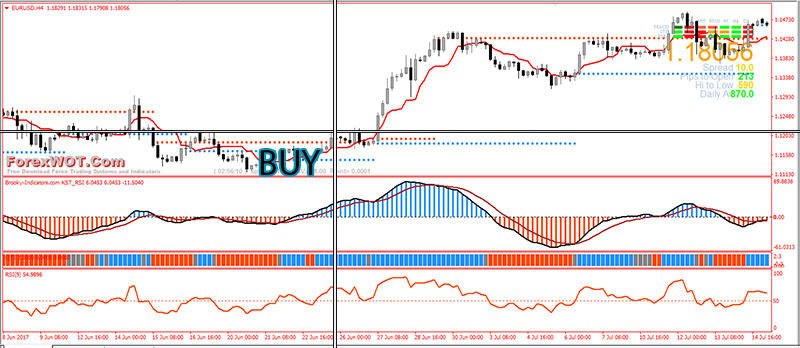
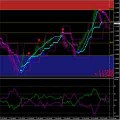
Now I’ll show you how effective is “Forex Trend Momentum Brooky Support Resistance System”
- The trading system works well on H1, H4, and D1 time frames.
- Financial market: Indices, Commodities, and Forex.
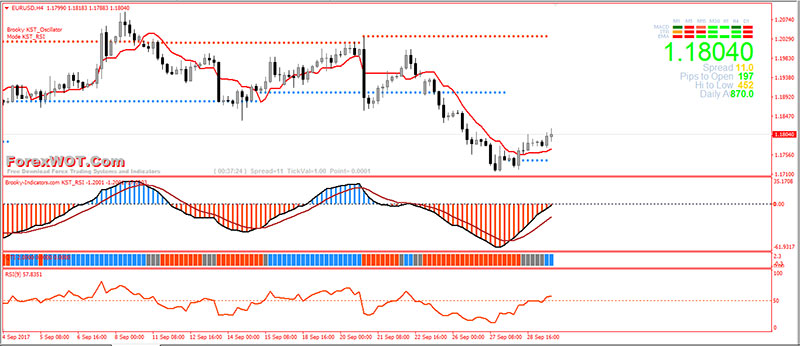
- Brooky KST advanced Analysis V3 Chart
- Signal Trend
- The Tenka-Sen line of Ichimoku Kinko Hyo
- Brooky KST Advanced Analysis V3
- QTI
- Relative Strength Index
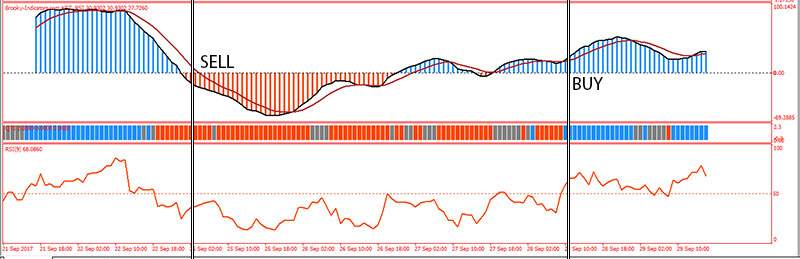
- The price passes through resistance lines (Red dots Brooky KST advanced Analysis V3 Chart indicator)
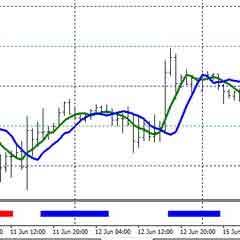
- Tenka-Sen line upward
- Brooky KST Advanced Analysis V3 Blue color histogram above 0 level
- QTI indicator Blue bars
- Relative Strength Index indicator line upward and above 50 level
- Signal Trend Green color bars
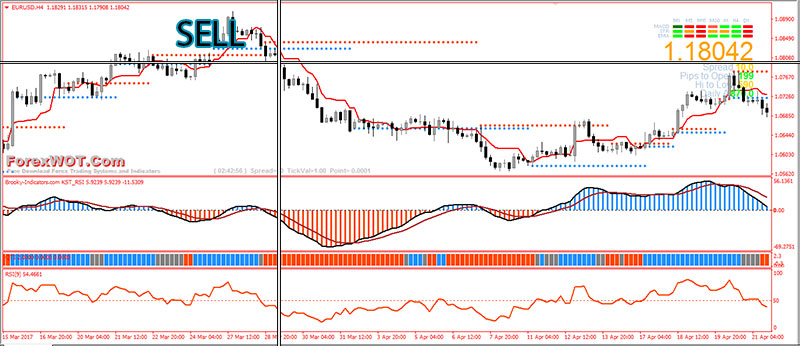
- The price passes through support lines (Blue dots Brooky KST advanced Analysis V3 Chart indicator)
- Tenka-Sen line downward
- Brooky KST Advanced Analysis V3 Red color histogram above 0 level
- QTI indicator Red bars
- Relative Strength Index indicator line downward and below 50 level
- Signal Trend Red color bars
- One of the most popular methods of technical analysis used by both institutional and retail traders is determining the resistance and support levels.
- Support and resistance are price zones, not exact numbers.
- When the price passes through a resistance, that resistance could potentially become support.
- Your initial Stop Loss is above the resistance area (for BUY) or below the support area (for SELL).
- Best Risk Reward Ratio is 1:2 or 1:3
 FTR Sigline Turtle Channel Trading Strategy
 KST – MACD Super Effective Forex and Stocks Trading Strategy
 DAMIANI Forex Trading Strategy of MACD with Alligator Indicator
 The Best Way to Learn Forex Trading
 How to Make a Living Trading Forex
 Forex Advanced Breakout Trend Easy and Simple System for Trading Success
 Forex Currency Trading Course : How to Trade Forex Successfully with U-TURN Cross Over Trading System
 FREE DOWNLOAD Top 10+ Best Forex Trading Systems for Beginners
 Mapping Forex Price Action Trading Strategy
 The Most Accurate Continuation Candlestick Patterns in Forex and Bitcoin Market
