FREE DOWNLOAD the best tool to draw TrendLines perfectly and automatically every time.

I’m going to share a secret way that I like to use trendlines to spot potential tops and bottoms in a market, so be sure to read the lesson in its entirety.
TrendLines are a staple for technical Forex traders that can be used on ANY CURRENCY PAIRS and on ANY TIME FRAMES.
They are easy to understand and can be used in combination with any other tools you might already be using.
By definition, a trendline is a line connecting two or more lows or two or more highs, with the lines projected out into the future.
Ideally, traders look at these extended lines and trade on prices reacting around them, either trading a bounce off the trendline.
So, what can we do to make sure the trendlines that we’ve drawn are sound…?
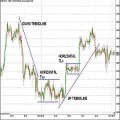
Connect Swing Lows to Swing Lows (or Swing Highs to Swing Highs)
For those unfamiliar with the term swing highs/lows, we simply mean the peaks or FRACTALS.
Once we connect FRACTAL with other FRACTAL, we want to see the line not being broken by any candle between those two points.
Take the examples below.
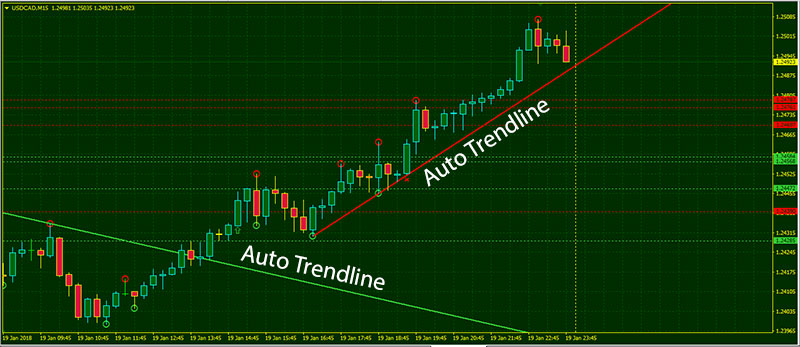
What we see in the image above, two swing lows (fractals) connected together by a line unbroken by price.
This is a VALID TRENDLINE that is ready to be projected out into the future.
We all know that NO TRENDLINE WILL LAST FOREVER.
So this article focuses on “HOW TO TRADE TRENDLINES WHEN THEY BREAK“.
- Best Timeframes:
- H1 for intraday trading
- H4 and D1 for short-term swing trading
- D1 and W1 for long-term swing trading
- Most Recommended Currency Pairs:
- EURUSD and GBPUSD for intraday trading
- All low and medium spread currency pairs for swing trading
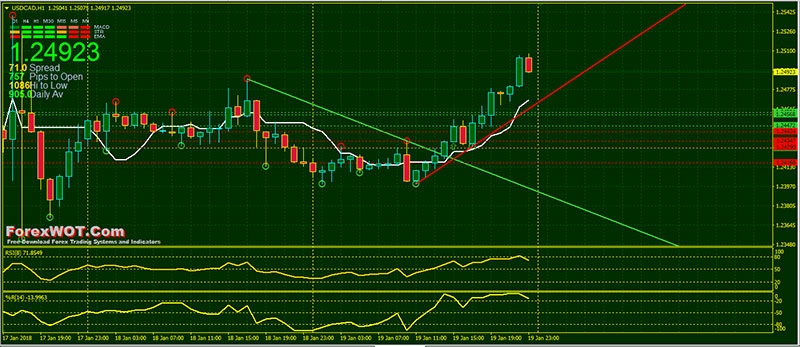
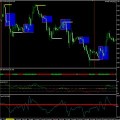
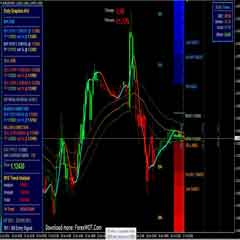
- Fractals Trendline
- Tenkan-Sen Ichimoku Kinko Hyo
- RSI Trend Momentum
- WPR
- Signal trend
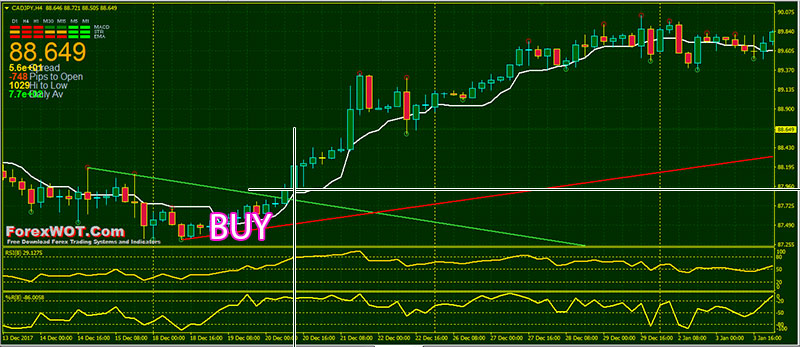
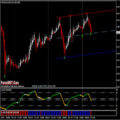
- Price break above the green color “resistance” Fractals Trendline indicator
- Price above the Tenkan-Sen line
- RSI Trend Momentum line upward and above the 50 level
- WPR line upward and above the -50 level
- Signal trend green color bars
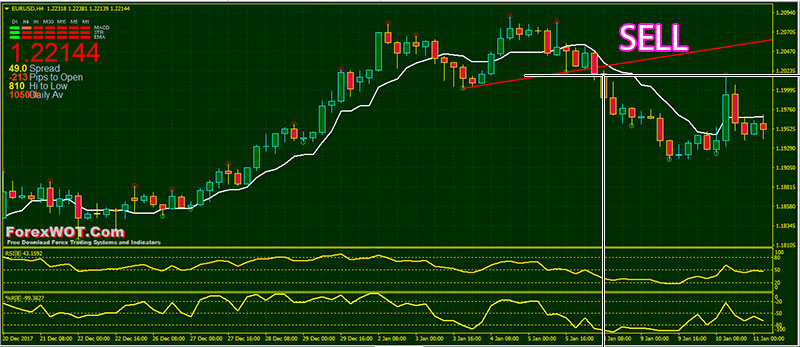
- Price break below the red color “support” Fractals Trendline indicator
- Price below the Tenkan-Sen line
- RSI Trend Momentum line downward and below the 50 level
- WPR line upward and below the -50 level
- Signal trend red color bars
This trendline trading system focuses on the latter.
So we wait to see if the price does, in fact, break through the price.
But we aren’t ready to place a trade just because the price breaks through the trendline.
We need to wait and see if the current candle closes beyond the trendline. We require a candle to close beyond the trendline to confirm the breakout. This is a very important rule.
 How to Do Accurate Forex Trend Line Analysis
 How Do I Become a Good and Prifitable Forex Trader
 Foreign Exchange Currency Trading & Investment Strategy – Forex Z 20 System for Successful and Highly Profitable Forex Trader
 How To Trade The Trendline-Channel RSI For High Probability Trades
 High Accuracy Volty Channel Stop RSI Trading Strategy and How to Win Consistently in Forex Trading
 Forex Auto Trend ZigZag BUY SELL Trading with RSI and Trend Candles Filter
 Best Forex & Stocks Trading Strategy with Dolly-Graphics System
 Forex Bill Williams Market Facilitation Index (BW MFI) Multi Trend Trading System and Strategy
 High Probability Trading: The 10 Pips Forex Trading Strategy
 Guppy Trend Line: A Simple Technique to Improve Your Trend Line Breakouts Strategy
