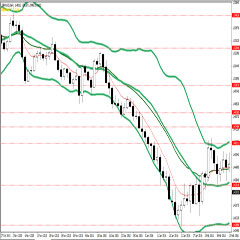
FREE DOWNLOAD – TOP 10 Best Bollinger Bands Forex Trading System and Strategy – Bollinger Bands® are a technical chart indicator popular among traders across several financial markets. On a chart, Bollinger Bands® are two “bands” that sandwich the market price.

Many traders use them primarily to determine overbought and oversold levels. One common strategy is to sell when the price touches the upper Bollinger Band® and buy when it hits the lower Bollinger Band®.
This technique generally works well in markets that bounce around in a consistent range, also called range-bound markets. In this type of market, the price bounces off the Bollinger Bands® like a ball bouncing between two walls. And bellow are TOP 10 Best Bollinger Bands Forex Trading System and Strategy:
1. Easy Moving Average and Bollinger Bands Forex Trading System
Easy Trade Forex with Moving Average and Bollinger Bands – Moving averages are simple to use and can be effective in recognizing trending, ranging, or corrective environments so that you can be better positioned for the next move. Often traders will use more than one moving average because two moving averages can be treated as a trend trigger.
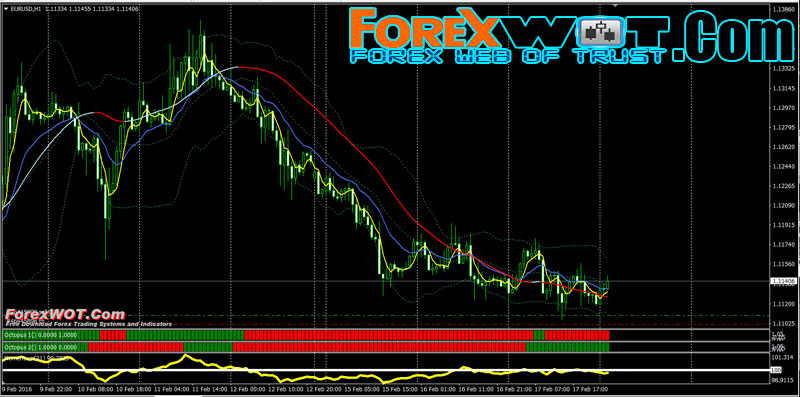
Moving Averages are often the first indicator that new traders are introduced to and for good reason. It helps you to define the trend and potential entries in the direction of the trend. However, moving averages are also utilized by fund managers & investment banks in their analysis to see if a market is nearing support or resistance or potentially reversing after a significant period.
Bollinger Bands® is the second important indicator I use along with Moving Average. In fact, the combination of Moving Average and Bollinger Bands creates the strong trade setups I look for.
Bollinger Middle Band is nothing but a simple moving average. Bollinger Upper and Lower Bands measure deviations. I can bring their formula here, but it will not have any usage for your trading. The only thing we should know is that they are so strong in locating the trends and reversals. Combining the Moving Average with Bollinger Bands, creates a great trading system that shows the strongest continuation and reversal trade setups.
2. Awesome Oscillator Forex Trading Strategy with Bollinger Bands and Heiken Ashi Histogram
Successfull Forex Awesome Oscillator Trading System with Bollinger Bands and Heiken Ashi Histogram – Awesome Oscillator (AO) is a momentum indicator reflecting the precise changes in the market driving force which helps to identify the trend’s strength up to the points of formation and reversal.
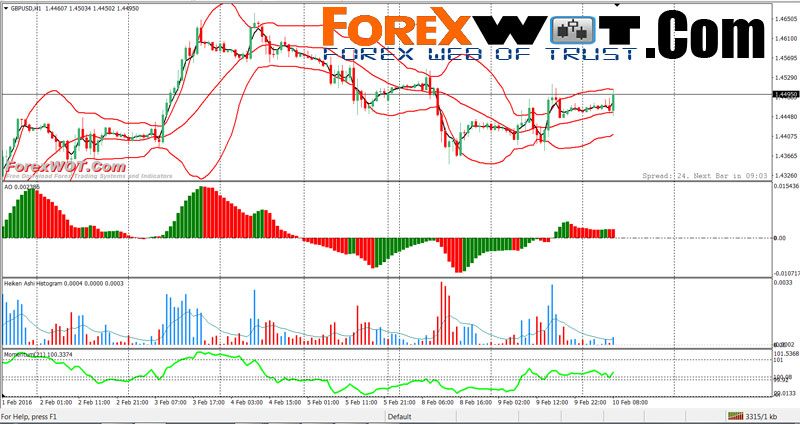
Awesome Oscillator Strategy includes 3 ways of trading. The first way is to open a sell position when the oscillator is below the zero line forming a peak, and open a buy position when the oscillator is above the zero line forming a gap.
Another way is to open a sell position when the oscillator forms two peaks above the zero line, where the second high is lower than the previous one. And, conversely, traders watch to open a buy position when the oscillator forms to lows below the zero line with the last one not as low as the previous one.
The third way is to account crossing the zero line. When the oscillator crosses it from up to down, it is time to open a sell position and when it crosses from down to up, it is time to open a buy position.
3. Forex Bollinger Bands with Zigzag and Commodity Channel Index
Forex Bollinger Bands Trading System – Bollinger Bands® are one of the most popular technical indicators for traders in any financial market, whether investors are trading stocks, bonds or foreign exchange (FX). Many traders use Bollinger Bands® to determine overbought and oversold levels, selling when price touches the upper Bollinger Band® and buying when it hits the lower Bollinger Band®.
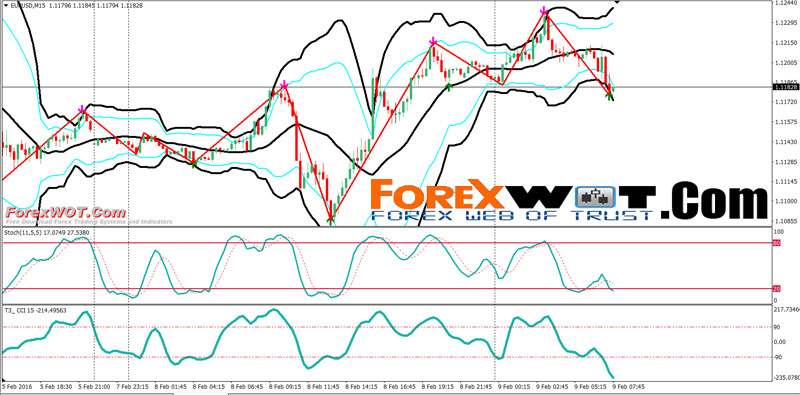
The purpose of Bollinger Bands is to provide a relative definition of high and low. By definition prices are high at the upper band and low at the lower band. This definition can aid in rigorous pattern recognition and is useful in comparing price action to the action of indicators to arrive at systematic trading decisions.
One of the other great advantages of Bollinger Bands® is that they adapt dynamically to price expanding and contracting as volatility increases and decreases. Therefore, the bands naturally widen and narrow in sync with price action, creating a very accurate trending envelope.
Commodity Channel Index (CCI)
The CCI was originally developed to spot long-term trend changes but has been adapted by traders for use on all time frames. Here are two strategies that both investors and traders can employ.
The CCI compares the current price to an average price over a period of time. The indicator fluctuates above or below zero, moving into positive or negative territory. While most values, approximately 75%, will fall between -100 and +100, about 25% of the values will fall outside this range, indicating a lot of weakness or strength in the price movement.
4. Forex Intraday Bollinger Bands Support Resistance Trading System
Forex Intraday Trading Strategy. Forex Bollinger Bands Support Resistance Trading System is very easy but high profitable. And Bollinger bands are a very powerful technical indicator. Some traders will swear that solely trading bollinger bands is the key to their winning systems.
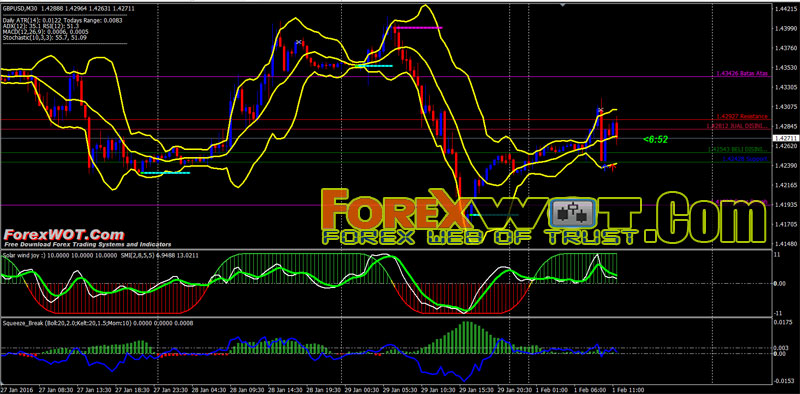
These are a few of the great methods for trading bollinger bands. I am not one to use many indicators on my charts due to the cluttered feeling I get. Keep it simple. If you feel the need to add additional indicators to confirm your analysis, make sure to test it out thoroughly in advance to putting any trades on.
5. Forex Trading Stochastic Bollinger Bands with Keltner Channel Indicator
Solid Forex Trading Tips – How to Win Forex Trading Stochastic Bollinger Bands. Or this is Keltner Channel and Bollinger Bands Reversal forex trading system. Most technicians will use Bollinger Bands® in conjunction with other indicators, but we wanted to take a look at a simple strategy that uses the bollinger bands and oscillator stochastic to make trading decisions.

Bollinger bands are a very powerful technical indicator. Some traders will swear that solely trading bollinger bands is the key to their winning systems.
Bollinger bands are drawn within and surrounding the price structure of a stock. It provides relative boundaries of highs and lows. The crux of the bollinger band indicator is based on a moving average that defines the intermediate term trend of the stock based on the trading timeframe you are viewing it on. This trend indicator is known as the middle band.
Most stock charting applications default the middle band to a 20 period moving average. The upper and lower bands are then a measure of volatility to the upside and downside. They are calculated as two standard deviations from the middle band.
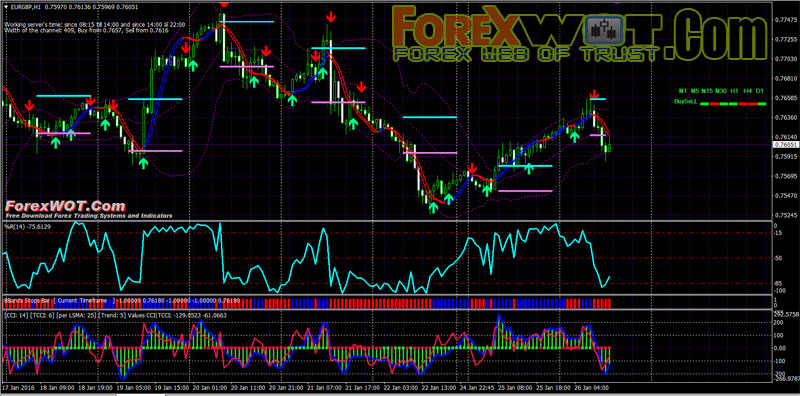
6. Forex Multi Bollinger Bands Stop H1 Trading System with Kinjun Sen and MTF MACD Indicator
Super easy and high accuracy Forex Multi Bollinger Bands Stop Trading System with Kinjun Sen and MTF MACD Indicator – So this strategy is called the Multi Bollinger Bands Stop Strategy which I have been tinkering around with for a while and wanted to share and get a discussion going.

The strategy uses four BBands Stop indicators and some pretty well known custom indicator. In this strategy it ( BBands Stop indicators ) will be used primarily as a trend identifier. We will only take trades in the direction of the trend so BUY in an uptrend and SELL in a downtrend.
And MACD is one of the most reliable indicators. Although we do not believe in using any indicators in our own trading and we always use the candlesticks charting and Bollinger Bands Stop to find the trade setups, still we believe that MACD is a strong indicator specially for novice traders who are used to get in and out of the market too early.
MACD is a lagging indicator and its delay makes you be patient, not to rush to enter the market or get out of it too early.
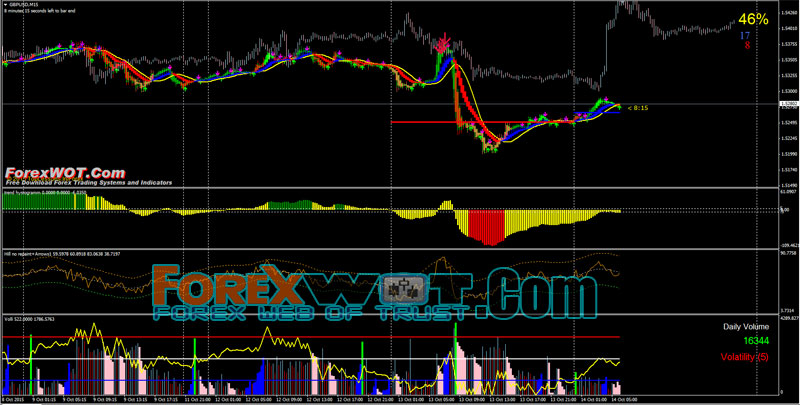
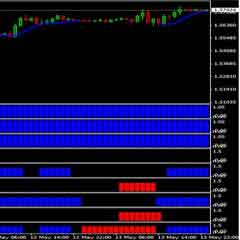
7. Forex Williams Percent Range Trading Strategy with Bollinger Band Stops Bars and TriggerLines Indicator
Forex H1 Williams Percent Range Trading Strategy – In technical analysis, this is a momentum trading system measuring overbought and oversold levels, similar to a stochastic oscillator. Williams %R was developed by Larry Williams and compares a stock’s close to the high-low range over a certain period of time, usually 14 days.
[sociallocker]
[/sociallocker]
Williams %R is used to determine market entry and exit points. The Williams %R produces values from 0 to -100, a reading over 80 usually indicates a stock is oversold, while readings below 20 suggests a stock is overbought.

The Williams Percent Range indicator is composed of a single fluctuating curve. Traders will occasionally add a Smoothed Moving Average, as above in “Red”, to enhance the value of the trading signals. In the example above, the “Blue” line is the Williams Percent Range, while the “Red” line represents a “SMA” for “14” periods.
The Williams Percent Range is viewed as a “leading” indicator, in that its signals foretell that a change in trend is imminent. The weakness in the indicator is that timing is not necessarily a product of the %R oscillator, the reason for attaching a “lagging” moving average to confirm the Williams Percent Range signal.
Forex traders favor the Williams Percent Range indicator because of its ability to foretell reversals one to two periods ahead of time. As with any oscillator, one should wait until actual pricing behavior confirms the reversal.
8. Forex Bollinger Bands Trading System with 4 Time Frame Gann Hilo Indicator
High Accuracy Forex Bollinger Bands Trading System – Bollinger Bands® are volatility bands placed above and below a moving average. Volatility is based on the standard deviation, which changes as volatility increases and decreases.
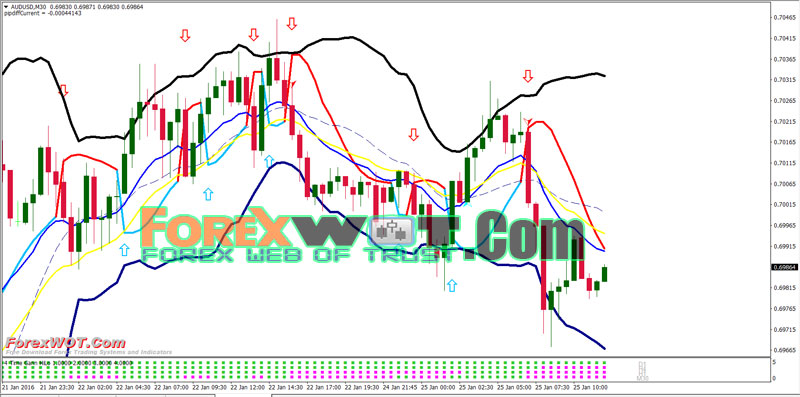
The bands automatically widen when volatility increases and narrow when volatility decreases.
This dynamic nature of Bollinger Bands also means they can be used on different securities with the standard settings.
For signals, Bollinger Bands can be used to identify M-Tops and W-Bottoms or to determine the strength of the trend. Signals derived from narrowing BandWidth are discussed in the chart school article on BandWidth.
9. Forex Easy Fractal Breakout Strategy with Bollinger Bands and MACD
Forex Easy Fractal Breakout Strategy with Bollinger Bands and MACD is intraday forex trading system based on fractals, MACD, Bollinger Bands, and Ang Zad indicator.

Fractal is a trading indicator which forms tops and bottoms of the market movement. These tops and bottoms act as support and resistance.
This strategy is made with the breakout of this fractal in the trend direction. MACD is used in this strategy for identifying the trend and so success rate of this strategy is very fine.
Bollinger Bands® consist of a center line and two price channels (bands) above and below it. The center line is an exponential moving average; the price channels are the standard deviations of the stock being studied. The bands will expand and contract as the price action of an issue becomes volatile (expansion) or becomes bound into a tight trading pattern (contraction).
10. Advanced Accurate Forex Bollinger Bands Trading System
Bollinger Bands with Val Bands Trading – Advanced Accurate Forex Bollinger Bands Trading System is a volatility-trend following strategy for intraday trading but it’s also good for swing or for trading with binary options high/low.
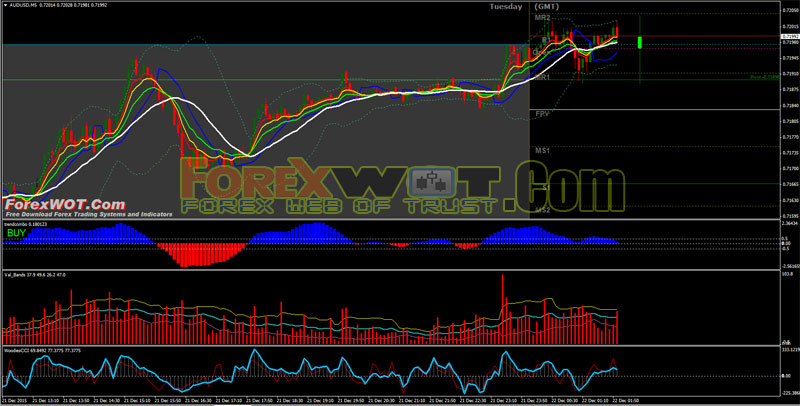
What’s a Bollinger Band…? Bollinger Bands® consist of a center line and two price channels (bands) above and below it.
The center line is an exponential moving average; the price channels are the standard deviations of the stock being studied.
The bands will expand and contract as the price action of an issue becomes volatile (expansion) or becomes bound into a tight trading pattern (contraction).
A stock or currency may trade for long periods in a trend, albeit with some volatility from time to time. To better see the trend, traders use the moving average to filter the price action.
BONUS : Notradamus Trading Strategy – How to Predict Movement in the Forex Market
How to Predict Movement in the Forex Market with Nostradamus forex system is a trading system complex based on more indicators, there is also Nostradamus indicator based on Neural Networws.
[sociallocker]
[/sociallocker]
Nostradamus forex system is a intraday strategy.
- Time frame : 5 min, 15 min, 30 min.
- Currency pairs : majors: AUD/USD, GBP/USD, USD/CHF, EUR/USD, NZD/USD, AUDJPY, USD/JPY.
 FREE DOWNLOAD Top 10 Forex Currency Trading Systems With Bollinger Bands Indicator
 FREE DOWNLOAD 20+ Best Forex MACD-Moving Average Trading System
 MA COBRA Forex & Stocks Trading Strategy (Extremely Low Risk High Reward Trading Strategy) (COBRA SYSTEM)
 TOP10 BEST Full Time Forex Trader Trading System and Strategy
 2 MACD Effortless Forex & Stocks Swing Trading Strategy
 Top 10 Forex ADX Trading System (High Accuracy ADX System)
 High Profits and Super Effective FCP Forex Trading System (Forex Secret Protocol)
 Top 10 Strategy to Build on Your Winning Forex Open Positions
 FREE DOWNLOAD Top 10+ Best Forex Trading Systems for Beginners
 Foreign Exchange Trading : Online Forex Master Level Trading System and Strategy

Thanks again for a very decent upload! Can I please request that if there is a corresponding details page for any of the strategies in this list, you add links to that page so I can read about the strategy in more detail? Thanks!
Hi Matt, just open the “User Guide URL.txt” file
Forexwot is the BEST forex trading system site on the earth
Many Thanks,