High Accuracy and Works on All Time Frame Forex Trading System – The MACD is appreciated by traders the world over for its simplicity and flexibility because it can be used either as a trend or momentum indicator.

Trading divergence is a popular way to use the MACD histogram, but, unfortunately, the divergence trade is not very accurate – it fails more than it succeeds.
To explore what may be a more logical method of trading the MACD divergence, we look at using the MACD histogram for both trade entry and trade exit signals (instead of only entry), and how currency traders are uniquely positioned to take advantage of such a strategy.
MACD Trading Concept
The concept behind the MACD is fairly straightforward. Essentially, it calculates the difference between an instrument’s 26-day and 12-day exponential moving averages (EMA). Of the two moving averages that make up the MACD, the 12-day EMA is obviously the faster one, while the 26-day is slower.
In the calculation of their values, both moving averages use the closing prices of whatever period is measured. On the MACD chart, a nine-day EMA of the MACD itself is plotted as well, and it acts as a trigger for buy and sell decisions.
The MACD generates a bullish signal when it moves above its own nine-day EMA, and it sends a sell sign when it moves below its nine-day EMA.
The MACD histogram is an elegant visual representation of the difference between the MACD and its nine-day EMA. The histogram is positive when the MACD is above its nine-day EMA and negative when the MACD is below its nine-day EMA.
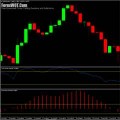
If prices are rising, the histogram grows larger as the speed of the price movement accelerates, and contracts as price movement decelerates. The same principle works in reverse as prices are falling. See Figure 1 for a good example of a MACD histogram in action.
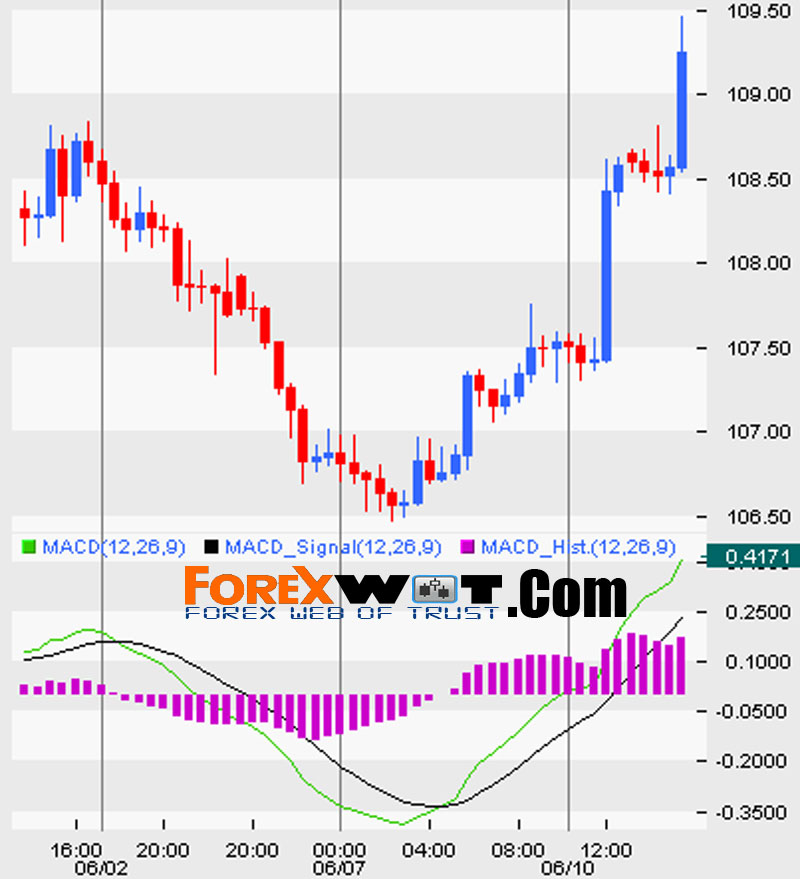
Figure Above: MACD histogram. As price action (top part of the screen) accelerates to the downside, the MACD histogram (in the lower part of the screen) makes new lows.
The MACD histogram is the main reason why so many traders rely on this indicator to measure momentum, because it responds to the speed of price movement. Indeed, most traders use the MACD indicator more frequently to gauge the strength of the price move than to determine the direction of a trend.
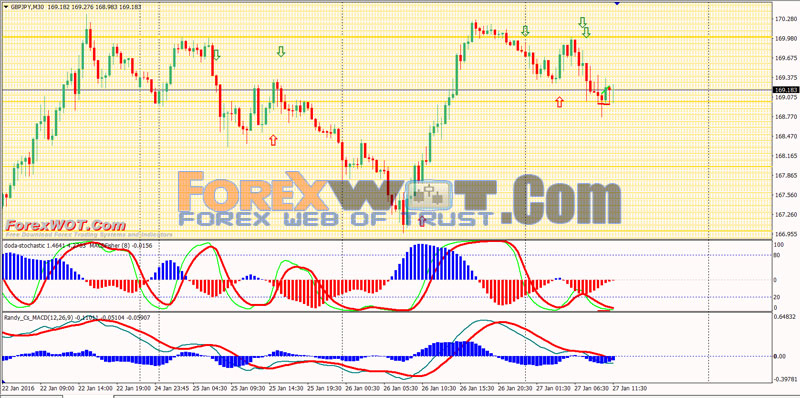
This Works on All Time Frame MACD divergence trading system is based on two divergence indicators and works on the all time frame. Here I show how it work at the time frame 30 min. Best trading session: London and New York.
Metatrader indicators:
- Sweet Spot,
- MACD Fisher,
- FXCX Divergence indicator (5,13,21,),
- MACD Divergence indicator (12, 26 9),
- Doda Stochastic indicator ( 5,13, 5 setting for 5 min and 15 min time frame, for other time frame the setting is 5, 8, 5).
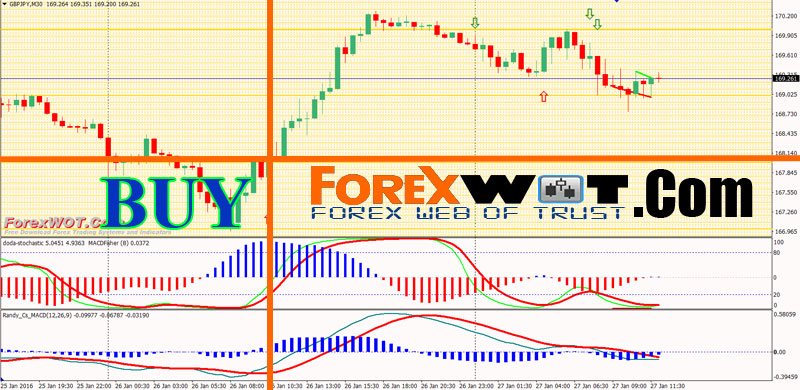
Works on All Time Frame Forex MACD Divergence Trading System and Strategy Rules
- Buy Arrow FXCX Divergence indicator;
- MACD Fisher blue bar and > 0;
- MACD Divergence indicator>0;
- Doda Stochastic indicator go upward from oversold area.<70
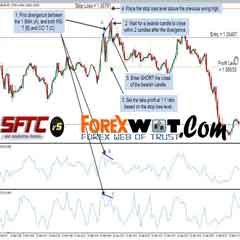
- Sell Arrow FXCX Divergence indicator;
- MACD Fisher red bar and < 0;
- MACD Divergence indicator<0;
- Doda Stochastic indicator go downward from overbought area but<30
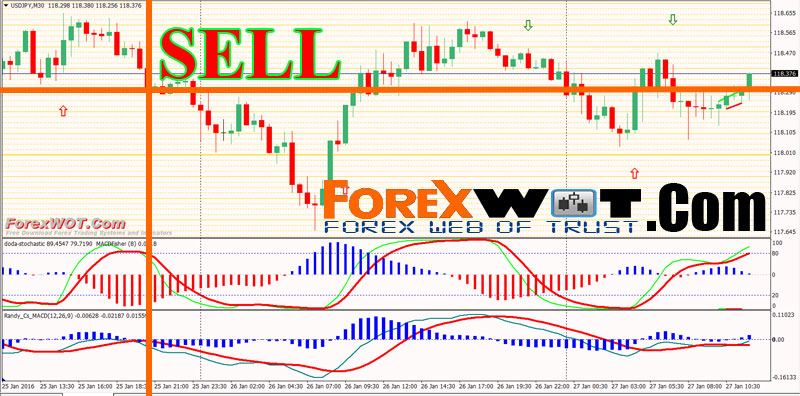
- Fast Profit Target 200-300 pips.
- Stop loss above or below the entry bar.
NOTE:
Currency traders are uniquely positioned to take advantage of this strategy because with this strategy, the larger the position, the larger the potential gains once the price reverses – and in Forex, you can implement this strategy with any size of position and not have to worry about influencing price. (Traders can execute transactions as large as 100,000 units or as little as 1,000 units for the same typical spread of three to five points in the major pairs.)
In effect, this strategy requires the trader to average up as prices temporarily move against him or her. This, however, is typically not considered a good strategy.
Many trading books have derisively dubbed such a technique as “adding to your losers“.
However, in this case the trader has a logical reason for doing so – the MACD histogram has shown divergence, which indicates that momentum is waning and price may soon turn.
In effect, the trader is trying to call the bluff between the seeming strength of immediate price action and the MACD readings that hint at weakness ahead. Still, a well-prepared trader using the advantages of fixed costs in forex, by properly averaging up the trade, can withstand the temporary drawdowns until price turns in his or her favor.
 20 Halloween Costumes From Amazon All Traders will Actually Want To Wear
 2 MACD Effortless Forex & Stocks Swing Trading Strategy
 FREE DOWNLOAD 20+ Best Forex MACD-Moving Average Trading System
 Forex and Crypto “MORNING TRADE” Trading Strategy for Advanced Traders
 FOREX 1 MIN Scalping Trading Tricks By The Most Successful Forex Trader
 5 Minute Chart Surefire RSI-CCI Forex Trading System and Strategy
 10 Very Easy and Accurate FOREX MACD Trading System
 Advanced Moving Average Forex Trading Tutorial – How To Become A Successful Forex Trader With Moving Average Indicator
 Forex Trading Training : How to Use MACD Divergence Profitable Forex Strategy In 4 Easy Steps
 MACD RSI Trading – The Easiest Way To Measure Forex Reversal Breakouts
