Exploiting Information About Economic Growth. Interest rate and inflation levels are the main ingredients of forex price movements, and economic growth data follows closely in shaping the currency flows. Countries that are experiencing economic growth generate more jobs in their economy. Consumer spending therefore increases. In turn, the demand for housing increases as people have more disposable income and can better afford housing.


Other sectors, such as the auto sector, also experience changes in demand as consumers’ propensity to spend reflects greater confidence regarding their economic conditions. The transactions of a modern economy intimately involve global flows of capital as exports and imports are part and parcel of the vitality of an economy. The term economic growth is really a wide category.
The rate of economic growth or development of a country is mainly measured essentially by its gross domestic product (GDP), so news about GDP becomes an essential ingredient in shaping trader sentiment about the value of a currency. A slowdown or expected slowdown in GDP translates into anticipation that interest rates will not go higher or may even decrease. This anticipation results in pressures to lower a currency’s value.
The importance of economic development statistics in currency trading is evidenced by the fact that whenever an economic data release is scheduled, the currency market hesitates in its price movements and then often moves vigorously when the news surprises the market. In fact, one of the best times to trade is after a news release. Technical strategies for trading the news will be thoroughly explored in a later chapter.
Traders can gain insight into economic growth and development data by following several sources that track global economic growth, such as the Organisation for Economic Co-operation and Development (www.oecd.org), the International Monetary Fund (www.imf.org), the Group of Seven, (www.g7.utoronto.ca), and the World Trade Organization(www.wto.org).
Employment data is used to determine how fast the economy is growing. A growing economy has new job creation and lower levels of employment. An economy that is slowing down (or showing signs of slowing down) has increased jobless claims, a declining rate of job creation, and higher unemployment levels.
Whenever job data is released by governments, the forex markets react. The forex markets look at whether the data is positive or negative for expectations of whether that country’s central bank will increase rates, keep rates the same, or decrease rates. There are many layers of information regarding employment data. The following list illustrates what’s trackable in the United States:
- Aggregate Weekly Hours Index: private nonfarm payrolls
- Aggregate Weekly Hours: private nonagricultural establishments
- Civilian Employment: 16 years and older
- Civilian Participation Rate
- Civilian Labor Force: 16 years and older
- Employment Ratio—Civilian Employ/Civilian Index of Help Wanted Advertising in Newspapers
- U.S. Manufacturing Employment
- Payroll Employment of Wage and Salary Workers
- Total Population of the United States
- U.S. Employment in Service-Producing Industries
- Civilian Unemployed for 15 Weeks and Over
- Civilian Unemployed for Less Than 5 Weeks
- Median Duration of Unemployment
- Unemployed: all civilian workers
- Unemployment Rate
- U.S. Employment in Construction
- U.S. Employment in Finance, Insurance, and Real Estate
- U.S. Employment in Goods-Producing Sectors
- U.S. Employment in Government
- U.S. Employment in Mining
- U.S. Employment in Services
- U.S. Employment in Transportation and Public Utilities
- U.S. Employment in Retail Trade Industry
- U.S. Employment in Wholesale Trade Industry
For more information on job data, visit the following web sites:
- www.economagic.com
- www.globalfinancialdata.com
Crude oil and its derivative products fuel the engine of economic growth. As long as the world is dependent on hydrocarbon-based energy, oil prices become a factor in stimulating or delaying economic growth. Economic studies demonstrate that for every $10 per barrel rise in oil prices, real GDP in the United States is reduced by about 0.4 percent economic growth.
In the near term, higher oil prices result in reducing economic growth expectations as well. Higher hydrocarbon prices portend increases in transportation costs and the perunit cost of outputs in the economy, and therefore become an inflationary factor in the costs of goods. More importantly, crude oil prices’ moving quickly higher disrupts anticipated prices and further encourages fears of slowdowns.
One of the most important aspects of oil prices is that the market reaction to oil price increases often tends to overemphasize its importance, particularly for the U.S. economy. Recent studies by the Federal Reserve show that an oil price shock can be easily absorbed in the $14 trillion U.S. economy.
Recent research shows that “a 100 percent increase in the price of crude oil . . . translates into only a 3.2 percent price increase in the typical basket of consumption goods. Since unrefined oil is not a consumer good, the oil price shock is passed through indirectly in the prices of many other goods and services” (Federal Reserve Bank of Cleveland, November 2006.
A quick rise in oil prices, or even just the fear of a rise, offers trading opportunities. Hurricane Katrina is a good example, as we saw some countries benefit from high crude oil prices, while others did not. The result impacts currency prices as well. Closely tracking oil is important in shaping currency-trading strategies. See Figure below .

Oil has another impact. Oil-producing countries have amassed huge sums of money, and what they do with their increasing petrodollars impacts currency values. The International Monetary Fund (IMF) reported that the surplus of dollars to oil producers amounts to $500 billion!
The economies of Organization of Petroleum Exporting Countries (OPEC) nations are accumulating current account surplus due to petrodollars that are nearing 30 percent of their GDP! If oil producers start to shift into nondollar assets such as the euro and pound sterling, the dollar fundamentally weakens. This has already begun.
The Financial Times reported on December 11, 2006, in a story titled “Oil Producers Shun the Dollar,” that the Bank of International Settlement data showed a shift into euro, yen, and sterling. OPEC and Russia data showed that the dollar holdings were cut from 67 percent to 65 percent. Also, the report indicated a cut by Iran of US$4 billion holdings and by Qatar of US$2.4 billion.
It was not a coincidence that the 2003 highs of the euro coincided with the last known shift of oil producers from dollars to euros. It is also not a coincidence that the Canadian dollar strengthens when oil prices increase and weakens when oil prices decline. We can see that crude oil patterns have had wide ranges and are likely to continue to have such swings. This will benefit the forex trader.
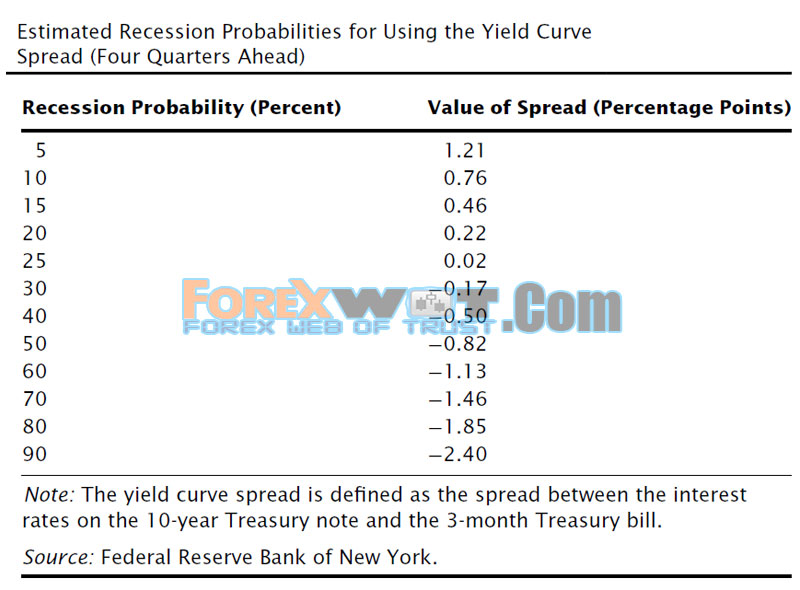
As Arturo Estrella and Frederic S. Mishkin said, “The yield curve—specifically, the spread between the interest rates on the ten-year Treasury note and the three-month Treasury bill—is a valuable forecasting tool. It is simple to use and significantly outperforms other financial and macroeconomic indicators in predicting recessions two to six quarters ahead” (“The Yield Curve as a Predictor of U.S. Recessions,” Current Issues in Economics and Finance, Federal Reserve Bank of New York, June 1996).
Guessing what phase of the business cycle an economy is in is a great game. Is the economy going into a recession? Since economic data mostly is lagging, we don’t know we have begun a recession until it actually has begun and been confirmed.
However, sentiment about an expected recession is not stopped by lack of data. One of the most important measures that traders track is the shape of the yield curve. The yield curve is defined as the difference between the 10-year Treasury note and the 3-month Treasury bill. We see here the key role that interest rates play in reflecting expectations in the market.
The Federal Reserve Bank of New York published an important study of the yield curve and recessions, which included a table relating probability of recession to the yield curve (Table below).
A separate study (see Figure below) shows the strong correlation of the yield curve as a precursor of a recession 4 months in advance.
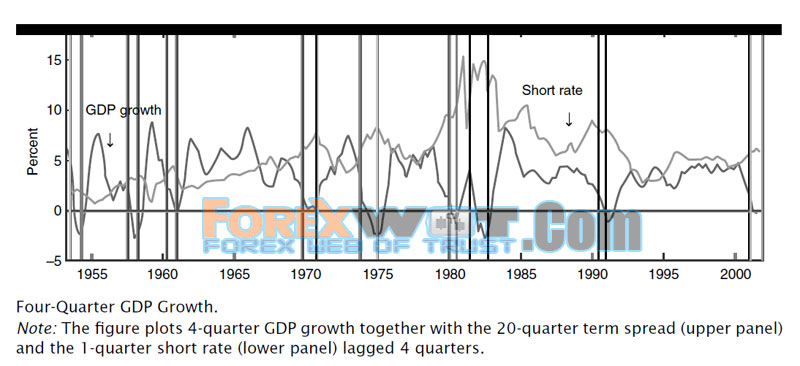
We can see that the yield curve provides an important barometer for the future GDP growth. With regard to the yield curve, what is particularly important to track for the forex trader is the shape of the yield curve.
- Is it flat?,
- Is it upward sloping?,
- Is it inverted?
These are the key patterns to observe. In normal times, people are willing to pay more for longer-term maturities and bonds. This is a natural reaction to the fact that there is more risk over a longer period of time. But a slowdown or fear of a recession causes the market to demand higher interest rates for short-term borrowing. The yield curve becomes inverted. Short-term interest rates become greater than longer-term rates!
A common interpretation is that when the yield curve inverts, a recession is coming. An inverted yield curve situation makes it difficult for the central banks to increase rates and more likely, in fact, that rates may decrease. Such a situation becomes negative for the dollar or any currency involved.
A flat yield curve indicates uncertainty about the economy. On December 27, 2005, the yield curve inverted for a few days for the first time in five years. Also, there is no guarantee that an inverted yield curve will always predict a recession, but when the yield curve inverts, the forex trader should be very vigilant. Strategies favoring a weaker dollar or currency pair should be considered.
A quick way to discern if the United States is nearing a recession is to generate an estimate of the probability of a recession based on the Federal Reserve hypothetical model. The formula (for those who want to set up an Excel spreadsheet) is (www.federal reserve.gov/releases/h15/update/):
NORMSDIST(−2.17 − 0.76*(10Year − 3Month) + 0.35*FederalFundsRate) Where:
10Year = 1-quarter Average of Daily 10-Year Constant Maturity Treasury Yields
3Month = 1-quarter Average of Daily 3-Month Constant Maturity Treasury Yields
Federal Funds Rate = 1-quarter Average of Daily Federal Funds Rates
The easiest way to do the calculations is to link to the following web site and input the data required in the formula. You can easily get the value of the 10-year Treasury bond, the 3-month yield, and the federal funds rate at www.federalreserve.gov/releases/h15/update/.
On March 21, according to the current model, the probability of a recession due to the relationship between the 10-year and 3-month bond yield curve was 52 percent. Table below shows the data inputs giving this result. One month later, on April 21, the data showed that the probability of a recession was even lower, at 45.9 percent.

These probabilities are the results of models. They are not guarantees but do give insights into what the professional economists are thinking.
A further visualization of the relationship between a recession and the yield curve as developed by the Federal Reserve researchers is shown in Figure 3.3. Obviously, a great

deal of work is being constantly done by economists to try to pinpoint the probability of a recession.
Using the Formula in this Section, Calculate the Probability of a Recession ona Weekly Basis
Check whether the probability is rising or falling as you are monitoring the results. At the same time, ask yourself the question: Is the dollar getting stronger or weaker? Doing this assignment will help you sharpen your understanding of sentiment toward the dollar and whether that sentiment reflects economic fundamentals.
 Forex Trading Strategy – WHY FUNDAMENTALS ANALYSIS ARE IMPORTANT
 Trade Like a Top Athlete – How to Set Up a Professional Trading Journal
 Forex Trading Success Secret – Conducting Your Own Forex Fundamental Analysis
 Simple Techniques How to Measure FOREX Market Sentiment
 Advanced Moving Average Forex Trading Tutorial – How To Become A Successful Forex Trader With Moving Average Indicator
 Best Easy Ultra Scalping Forex Strategy With 98% Incredible Accuracy
 The Most Powerful Forex & Bitcoin Trade Filter that Reduces Risk and Improves Your Strategy
 Top 10 Best EUR-USD Forex Trading Systems and Strategy
 Best Forex Renko Total System and Indicators (Advanced RENKO SYSTEM)
 Different Types of 4 Majors Forex Trading Time Frames
